Learn how to answer the interview question, ‘Walk Me Through a DCF’ like a pro and land your dream job in Investment Banking, Private Equity, or Investment Management. We’ll break everything down with a simple 5-Step Framework as well as tips on how to avoid common pitfalls.
Estimated reading time: 17 minutes
TL;DR
- Initially, keep your answer high-level for ‘Walk Me Through a DCF’…and let the interviewer pull you into the details.
- You need to understand the underlying concepts to master this question…just memorizing formulas is a recipe for disaster.
- You can answer this question in just 5 simple steps which we’ve listed below.
A Little Context on…‘Walk Me Through a DCF’
One of the most common Investment Banking Interview questions is ‘Walk Me Through a DCF’. It is easily one of the Top 10 Investment Banking Interview Questions and it can be intimidating to newcomers.
Many students aiming for top-tier Finance simply memorize the DCF formulas to answer this question. But they quickly find themselves in a jam when they can’t explain the underlying concepts.
You can make it easy with the simple Framework and Plain English explanations we share here. First though, just a few points on why Interviewers ask this particular question.

What is Discounted Cash Flow (DCF) and Why Does it Matter?
A common (and fair!) question is, “What is the point of a DCF in the first place?“.
Discounted Cash Flow Analysis (or DCF) is the core method of Business Valuation professionals use across the Finance world (Investment Banking, Private Equity, Investment Management, and Corporate M&A).
It’s one of the Three Primary Methods of Business Valuation. The other two methods of Business Valuation (Trading and Transaction Comparables) are ‘shorthand’ analyses underpinned by the DCF approach.
For now, the short story is that the DCF method is central to Business Valuation. As a result, interviewers ask this question a LOT to gauge whether prospective employees truly ‘get it’.
The Big Picture & Common Pitfalls: ‘Walk Me Through a DCF’
Before we get into the 5 Step Framework, let’s first address the approach to take when answering this question. As is the case when answering most Finance interview questions, you want to keep your answer very high-level at first. You can use the 5 Step Framework we provide below to help keep you on track.
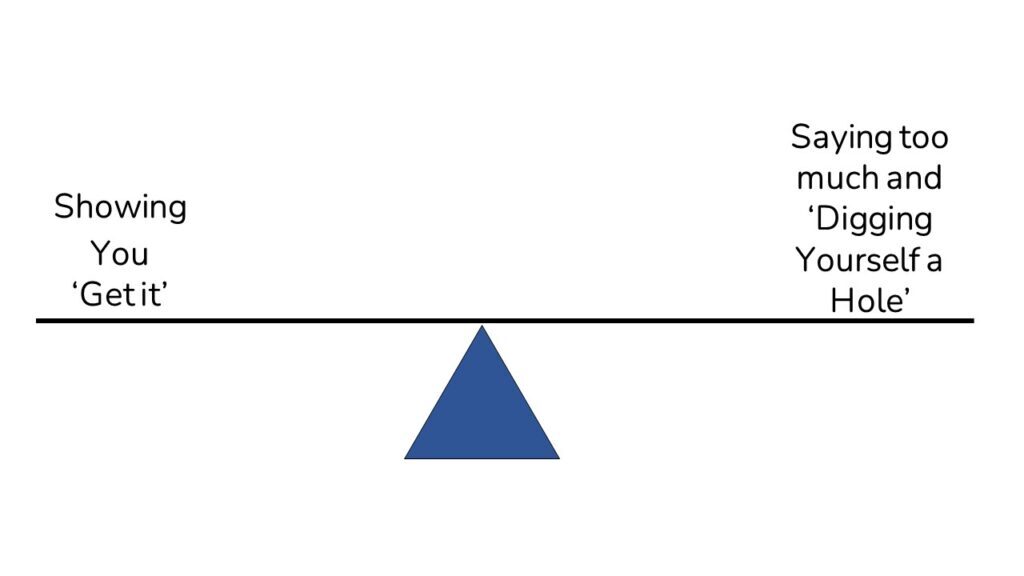
This avoids two common mistakes:
- Mistake #1: Seeming Long-Winded – If you give a long answer to the question it can seem like you don’t understand the concept and/or can’t give a succinct answer. Neither of those things reflects well on a prospective candidate.
- Mistake #2: Trying to Show off Your Knowledge – Let’s face it, the person sitting on the other side of the table in an interview has a huge leg up on you in most cases. They have likely been on the job for years and can run circles around you. If you try to show off how much you know, they will just take it to the next level. It’s nearly impossible to win this game.
By keeping it simple at the start, you can avoid these common mistakes. With that out of the way, let’s dive in here!
Quick Note: Levered vs Unlevered DCF
When an interviewer asks you to walk through a DCF Valuation, they could be asking for one of two approaches. The two approaches are Unlevered DCF (excludes Debt impact) or a Levered DCF (includes Debt impact).
On the job, the vast majority of Discounted Cash Flow analyses are Unlevered DCFs. As a result, the framework below focuses on just the Unlevered DCF approach.
‘Walk Me Through a DCF’ in 5 Steps
With that clarified, let’s now look at our 5 Step Framework.
To answer this question most effectively, you can break a Discounted Cash Flow analysis down into 5 easy Steps.
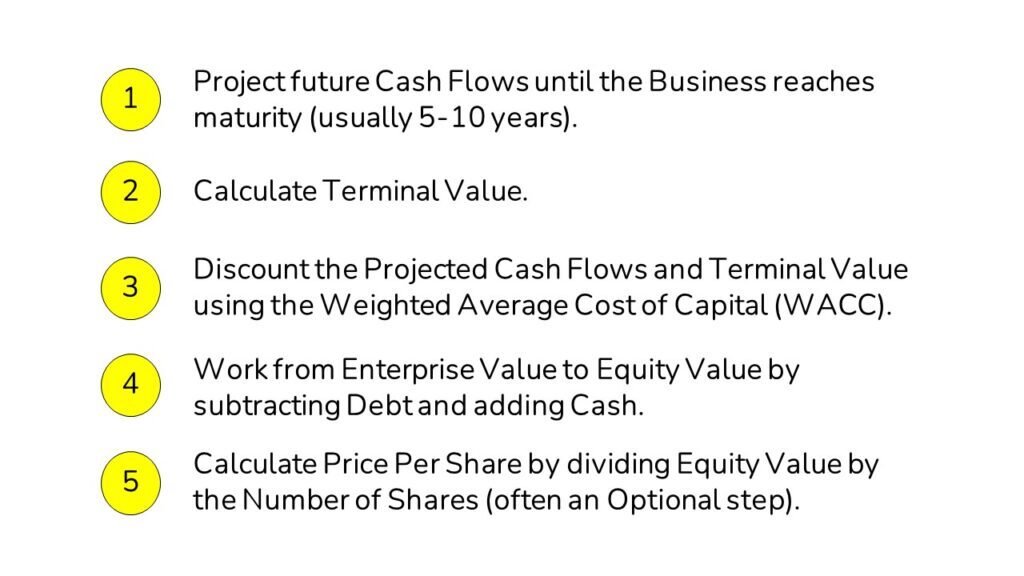
How to Answer ‘Walk Me Through a DCF’ in 5 Steps
- Project Future Cash Flows
Make detailed financial projections (usually for 5-10) years until the Business reaches maturity (i.e. GDP-level growth).
- Calculate Terminal Value
Use either the Perpetuity Growth or Exit Multiple method to calculate Terminal Value.
- Discount Projected Cash Flows and Terminal Value at WACC
Discount your Projected Cash Flows and Terminal Value at the Weighted Average Cost of Capital (WACC) to arrive at Enterprise Value.
- Work from Enterprise Value to Equity Value
Subtract Debt and add Cash to arrive at the value attributable to the owners of the business (i.e. Equity Value).
- Calculate Price Per Share
Divide the Equity Value by the Company’s total Share Count to arrive at Price Per Share.
In the sections below, we’ll walk through each of these steps in extensive detail. We’ll also explain the underlying idea behind each step.
‘Walk Me Through a DCF’ Step #1: Project Future Cash Flows
We first create explicit projections to compute the Business’ Cash Flows until the Business hits a ‘steady-state’ growth rate. Steady-state growth typically occurs 5-10 years into the future. This period of projections is referred to as ‘Stage 1’ of the DCF analysis.
Calculating Unlevered Free Cash Flow
Because this is an Unlevered DCF analysis, we ignore the impact of the Capital Structure (i.e. the level of Debt). As such, we do not incorporate deductions for Interest Expense or Principal payments for Debt in our Cash Flow calculations.
More specifically, we are calculating the Business’ Cash Flow including the impact of Taxes, Capital Expenditures, and Working Capital.
The formal name for this type of Cash Flow is Unlevered Free Cash Flow (or UFCF). Again, it’s ‘Unlevered’ because we don’t take into account the impact of Debt (a.k.a. Leverage). In the diagram below, we illustrate the calculation step-by-step in Plain English:
The goal with the calculations above is to continue these projections until the business hits a ‘Steady State’ level of growth in line with the overall economy (i.e. GDP Growth).
Two quick notes here.
First, EBIT includes a deduction for Depreciation and Amortization (D&A). We deduct D&A because it lowers our taxes.
Finance professionals describe this dynamic as the ‘Depreciation Tax Shield,’ which is a common Interview Question topic. For a deeper dive check out our article on the Depreciation Tax Shield.
Second, for a walkthrough of Levered Free Cash Flow, check out our Paper LBO deep-dive guide.
Now, let’s move on to Step 2.
Need to master DCF for Interviews (or the Job)?
Check our Valuation Fundamentals Course
Walk Me Through a DCF Step #2: Calculate Terminal Value
In Step 2, we will calculate all of the value that exists beyond the Stage 1 Cash Flows.
We refer to the phase beyond Stage 1 as Stage 2. And we call the value that exists in Stage 2 our Terminal Value.
Practitioners use two common methods to calculate Terminal Value: The Perpetuity Growth Method and The Exit Multiple Method.
Terminal Value Calculation Method #1 – Perpetuity Growth Method
If we wanted to value the Cash Flows that exist beyond Stage 1, we could make 100 years of projections…but that would be a TON of work.
Fortunately, we have a well-established formula to help. The Perpetuity Growth Formula takes our final year of Cash Flow from Stage 1, projects out all future Cash Flows (beyond Stage 1) at a constant growth rate (to infinity), and then Discounts those Cash Flows back to the final period of Stage 1.
The formula, which we’ve illustrated below, is called the Perpetuity Growth Formula. For more on the math behind this formula, check out this link.
One thing to note is that the Long-Term Growth (or ‘g’) should generally be in line with GDP growth. Otherwise, the business would outgrow the overall economy…which is probably not a reasonable assumption!
CRITICAL POINT: Terminal Value = Enterprise Value at the end of Stage 1
Before we dive into the second method, there’s a critical point that’s important to grasp here.
The present value of all the future Unlevered Free Cash Flows of a business Discounted back to any point in time, reflects the Purchase Price (i.e. Enterprise Value) of the business.
When we calculate Terminal Value using the Perpetuity Growth Method, we are simply doing a DCF of all Cash Flows beyond Stage 1.
As a result, you can also think of Terminal Value as the Enterprise Value of the business at the end of Stage 1.
Terminal Value Calculation Method #2 – Exit Multiple Method
Because Terminal Value represents the Enterprise Value of the Business at the end of Stage 1, we can take a shortcut here. To do that, we simply use Peer Valuation Multiples (typically EV/EBITDA) which we multiply by the appropriate Valuation Metric (in this case Year 5 EBITDA) to calculate our Terminal Value.
Now that we’ve calculated our Stage 1 and Stage 2 values for our Unlevered DCF, we need to pull the future Cash Flows back to today using Discounting.
Walk Me Through a DCF Step #3: Discount Cash Flows and Terminal Value by WACC
In Step 3, we calculate the Weighted Average Cost of Capital (or WACC). WACC is the Discount Rate we use to Discount our Cash Flows back to today.
The general idea here is to find a Discount Rate that reflects the risk of the Cash Flows stream being valued.
Once we’ve calculated WACC, we’ll show you how to calculate Discounted Cash Flow at the end of Step 3.
What’s the Big Idea Behind WACC?
The problem is that most businesses have multiple capital providers (i.e. Lenders and Investors) with different risk profiles.
Their risk profiles differ because Lenders are typically paid first in a Sale or Bankruptcy. So, Lenders take less risk than Investors. Investors take a higher level of risk because they are paid only after all the money owed to Lenders has been repaid.
As a result, Lenders and Investors have different expected rates of return. So, using either of their individual expected rates of return would incorrectly value the Business.
To solve this issue, we take a ‘Weighted Average’ of their expected returns. This Weighted Average reflects the blended average return for all providers of capital to the company. We call this blended average return the Weighted Average Cost of Capital.
The WACC Formula in Plain English
Below we’ve laid out the formula for the Weighted Average Cost of Capital and explanations for each component.
Weighted Average Cost of Capital (WACC) Components
- Debt / (Debt + Equity) – the value of Debt (typically Book Value) relative to the total value of Debt + Equity.
- Cost of Debt (Kd) – the current blended return expected by Lenders to the Company. Typically calculated as the weighted average Yield to Maturity for all components of the Company’s Debt. Note that we look at the Cost of Debt on an after-tax basis because Interest is tax-deductible, which lowers the true Cost of Debt.
- Equity / (Debt + Equity) – the value of Equity (always Market Value) relative to the total value of Debt + Equity.
- Cost of Equity (Ke) – the level of Return expected by Investors in the Business which is calculated using the Capital Asset Pricing Model (or ‘CAPM’) formula.
The Cost of Equity Formula (or CAPM)…also in Plain English!
Calculating the expected return of our Lenders is fairly simple. We look at the Interest Rate that they would charge to lend to the company…and that’s basically it.
Determining the expected rate of return required by Investors is a bit trickier because it’s not explicitly stated anywhere. Fortunately, there’s a well-established theory called the Capital Asset Pricing Model (or ‘CAPM’) to help us. The CAPM formula helps us to figure out what return Investors will expect.
Below are the components of the formula along with explanations for what each component represents:
Cost of Equity (or CAPM) Formula Components
- Risk-Free Rate (Rf) – sets a baseline for the level of return an Investor should expect if they take zero risk. The most common benchmark rate for Rf is the 10 Year US Treasury Note.
- Beta (β) – expresses ‘Risk’ by showing how a Stock moves relative to the Market (i.e. how Volatile it is). A Beta of 1 reflects the average Risk of the market. As this number increases, it reflects increasing Risk and thus results in a higher expected return for investors (and vice versa).
- Equity/Market Risk Premium (ERP or MRP) – shows the ‘Reward’ Investors have earned in the past for investing in Stocks (vs Risk-Free Bonds).
In short, this formula begins with a baseline return for a Risk-Free investment. It then ratchets up the Return (the Reward or ERP/MRP) expected by Investors based on the level of Risk (Beta) that the Investor is taking by investing in a particular Business.
What about Preferred Stock in WACC?
In some instances, you’ll see other components like Preferred Stock creep into the WACC formula. This is a common source of confusion for newcomers to Finance.
Remember that at the beginning of this section we said that we have to reflect the blended average Expected Returns of ALL providers of capital to the business? Well, if a company has Preferred Stock (or any other form of Debt or Equity), we have to incorporate that into our WACC calculation as well.
How to Discount Cash Flows
Once we’ve calculated our WACC, we then use the WACC to Discount our Stage 1 Cash Flows and Stage 2 (Terminal Value) back to today.
In substance, the sum of all of our Discounted Cash Flows represents the price we would pay for the right to those future Cash Flows, or the Purchase Price to buy the entire business which we call Enterprise Value.
In Step 4, we’ll work from (Enterprise Value) to the value attributable only to the Business Owners (Equity Value).
‘Walk Me Through a DCF’ Step #4: From Enterprise Value to Equity Value
To calculate Equity Value, we need to incorporate both Debt and Cash.
Let’s begin with Debt. Most businesses are funded with some level of Debt. And if the Business were ever sold, the Lenders need to be repaid before the Owners can collect any proceeds. As a result, we have to subtract Debt to get to the value attributable to the owners of the Business.
In addition, most Businesses will generate Excess Cash that accumulates in the company bank account over time. If an Owner sells their Business, they will typically keep the Excess Cash. As such, we add Excess Cash to reflect the fact that the Cash belongs to the Owner of the Business.
So, in short: Equity Value = Enterprise Value – Debt + Cash
After these completing these calculations, we arrive at the total value to the Owners (i.e. Shareholders) of a Business. But we’re not quite done though.
Most Businesses slice their Equity Value into numerous Shares so they can have a large number of Owners. In the next step, we’ll walk through how to calculate the value attributable to a single Share.
‘Walk Me Through a DCF’ Step #5: Calculating Price Per Share
As discussed in our Stocks vs Bonds explainer video, most businesses divide their ownership into many Shares. So, our final step is to calculate the value attributable to an individual Share.
Before we begin, note that we listed this last step as optional. In many cases, you can just calculate to Equity Value and stop. But sometimes the Interviewer might want you to work to Price Per Share in which case you can use this explanation.
To calculate the Price Per Share, we need to divide the Equity Value by the Number of Shares issued by the company. The problem is that companies have two distinct share counts:
- Basic Shares – reflects the number of Shares that are currently Outstanding.
- Fully Diluted Shares – current shares plus all potential Shares from employee Stock Option exercises, Restricted Stock, and any securities that are Convertible into additional shares. We calculate the number of potential shares with the Treasury Stock Method .
In short, we divide Equity Value by the Fully Diluted Share Count of the Business. This wraps up our fifth and last step in the DCF process.
Wrap-Up
Having a solid answer to ‘Walk Me Through a DCF’ is a core part of prepping for Technical Interview Questions for Investment Banking, Private Equity or Investment Management.
Hopefully, after reading through this, you have a much better understanding of both the 5 Step approach AND the underlying ideas behind the Question, ‘Walk Me Through a DCF’.
If you follow the approach laid out above and truly grasp the underlying concepts behind each step, you’ll be in great shape!

Let us know if you have any comments or questions below.
Interview Question Video: Walk Me Through a DCF
- If you’d like a video overview of this topic, check out our Walk Me Through a DCF video from our Founder, Mike Kimpel, with a full walkthrough of how to answer the question.
- Also check out our YouTube channel here for more interview question reviews for common questions like: Walk Me Through an LBO, How does $10 of Depreciation Flow Through the 3 Statements, and When to use EV/Revenue Multiples.
Frequently Asked Questions
The 5 steps to the Discounted Cash Flow process are:
1) Project Future Cash Flows.
2) Calculate Terminal Value.
3) Discount Cash Flows and Terminal Value by the Weighted Average Cost of Capital (or WACC).
4) Work from Enterprise Value to Equity Value.
5) Calculate Price Per Share.
DCF stands for ‘Discounted Cash Flow.’ In a DCF analysis, you value a Business based on its estimated future Cash Flows, which are discounted to reflect the Time Value of Money.
Discounted Cash Flow Analysis (or DCF) is a core valuation method in Investment Banking. With a DCF, you discount the future values of a business to arrive at its Intrinsic Value. This Intrinsic approach is then weighed against other market-oriented approaches like Trading and Transaction comparables.


Thank you so much. Appreciated this article and the LBO one. Studying for an IB Superday, and this is great – you’re helping a lot of people!