Master the Revenue Run Rate concept so you can use it on the job in Investment Banking, Private Equity, and Investment Management.
In this article, you will learn:
- Why the Revenue Run Rate matters.
- How to Calculate Revenue Run Rate.
- The pitfalls of Revenue Run Rate calculations.
- Other Run Rate Applications (SAAS ARR and EBITDA).
Estimated reading time: 12 minutes
TL;DR
- The Revenue Run Rate typically reflects Annualized Revenue.
- Seasonality and One-Time Items can distort Run Rate Calculations.
- Run Rate is used for various metrics (ARR, EBITDA, etc.) to show potential Annualized performance.
Want To Learn More About Finance?
Ramp up faster with all of our (free) deep-dive articles in our Analyst Starter Kit:
Why Does the Revenue Run Rate Matter?

You just landed your dream job. You are in your first meeting.
The boss turns to you and says, ‘this Company has grown 50% versus last Quarter. What’s the Run Rate based on last month?’
And all you can think about is ‘running’ out of the meeting to avoid embarrassment! Don’t worry. We’ve all been there!
In this article, we will clarify the Run Rate definition. And you will be able to answer any question related to Run Rates.
What is a Run Rate?
Revenue Run Rate is a critical concept to master if you are aiming for (or working in) Finance.
Let’s start with, how do we define ‘Run Rate?’
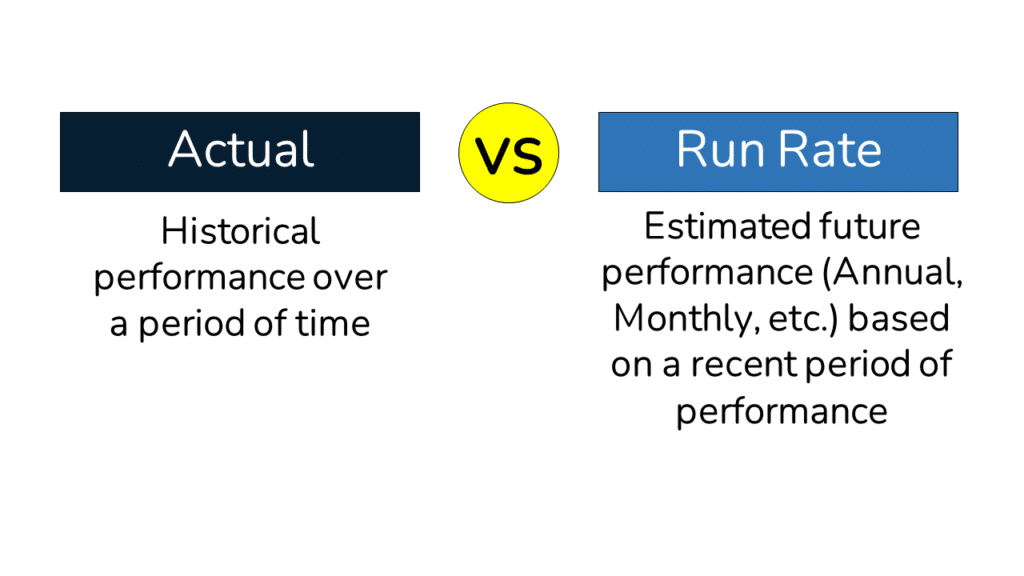
A Run Rate is the estimated future performance of a Business, based on a recent period of performance.
In other words, if we were to ‘run’ the recent period of performance into the future, how would that look?
In most cases, the Run Rate reflects estimated future Annual performance based on recent Monthly or Quarterly data.
How is Run Rate Used on the Job?
Finance professionals typically use Run Rate calculations when a Business experiences a big change and recent performance does not reflect potential future performance.
This concept is critical with early-stage, high-growth businesses. As growth accelerates for an early-stage Business, the current month may look nothing like the last.
But, as we will see, Run Rate calculations are used across nearly every area of Finance.
Now let’s take a quick detour and see how the Revenue Run Rate concept shows up in Interviews.
If you want to skip the interview discussion, you can hop right to the Revenue Run Rate Calculation by clicking here.
Revenue Run Rate in Interviews

While not as common as questions like ‘Walk Me Through a DCF’ or ‘Walk Me Through an LBO,’ Revenue Run Rate can come up in an Interview.
And you do not want to be caught flat-footed.
A few common interview questions are:
- What is the Revenue Run Rate?
- How do you calculate the Revenue Run Rate?
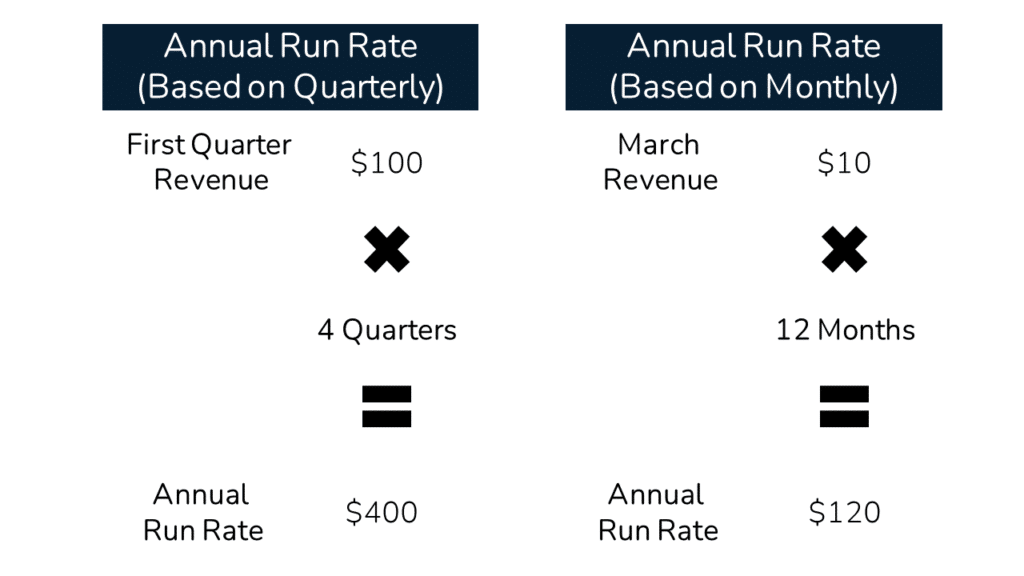
- A company has $100 in Revenue in the most recent month or Quarter. What’s the run rate?
To answer these questions, you will need to understand:
- The underlying meaning of ‘Run Rate’ (covered above).
- The Revenue Run Rate Calculation (next section) and common pitfalls (click here).
- Typical uses of Revenue Run Rate on the Job (click here).
After reading this article, you will nail any Interview Questions involving a Run Rate calculation.
Let’s dive in!
Calculate Annual Revenue Run Rate in 2 Steps
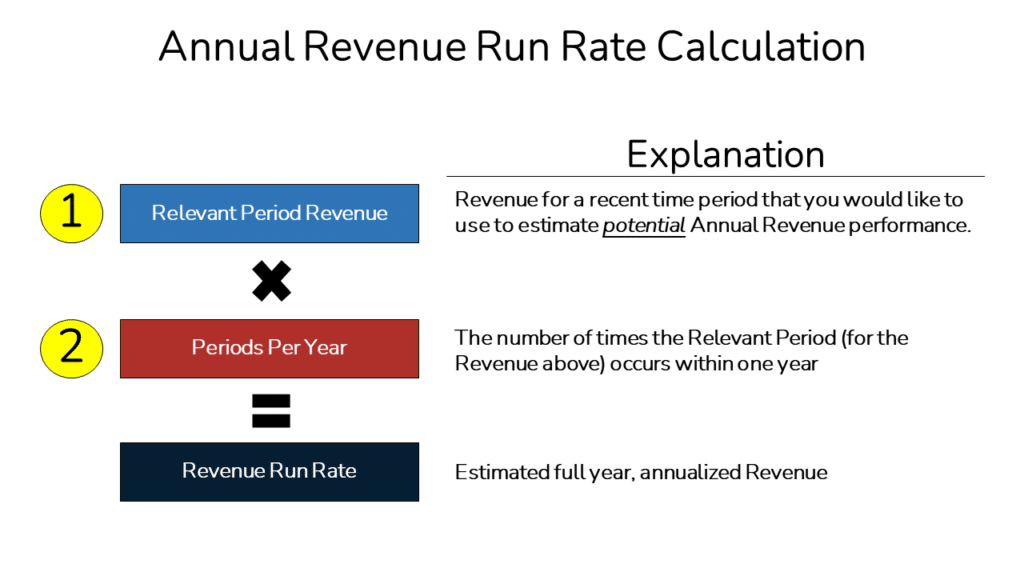
We’ll begin with the Annual Revenue Run Rate Formula, which breaks into just two steps:
How to Calculate the (Annual) Revenue Run Rate
- Find the Revenue for the Relevant Period
Find the Company’s Revenue for the Relevant Period. The Relevant Period is the recent period you want to use to estimate a full year of performance (typically the latest month or Quarter). With a public company, you often only have Quarterly performance. You can find quarterly data in the Company’s public financial filings (SEC Edgar Search).
If you are doing this exercise for your Company or a Privately held Client, you will need to ask the Accounting department or the Client, respectively for the numbers. - Multiply Revenue by the number of times the Relevant Period occurs within a Year
Determine the number of times the Relevant Period occurs in one year (e.g. 4 times for Quarterly and 12 times for Monthly data).
Then multiply the Revenue (from Step 1) by the number of times the Relevant Period occurs within one year.
Below are examples of Revenue Run Rate using both Monthly and Quarterly numbers.
Other Run Rates (Weekly, Monthly, etc.)
Thus far, we have focused on converting Monthly and Quarterly data to an Annual Run Rate because those are the most common applications.
With that said, we can apply Run Rate to any time period.
Below are a few examples:
- Weekly Run Rate (based on one day): Monday Revenue of $10 * 7 = $70 Revenue Weekly Run Rate.
- Monthly Run Rate (based on one week): January Week 1 Revenue of $100 * 4 = $400 January Monthly Run Rate Revenue.
In short, Run Rate is a concept that can be applied to nearly any time period to extrapolate future performance.
Annual Run Rate Revenue Example: Snowflake
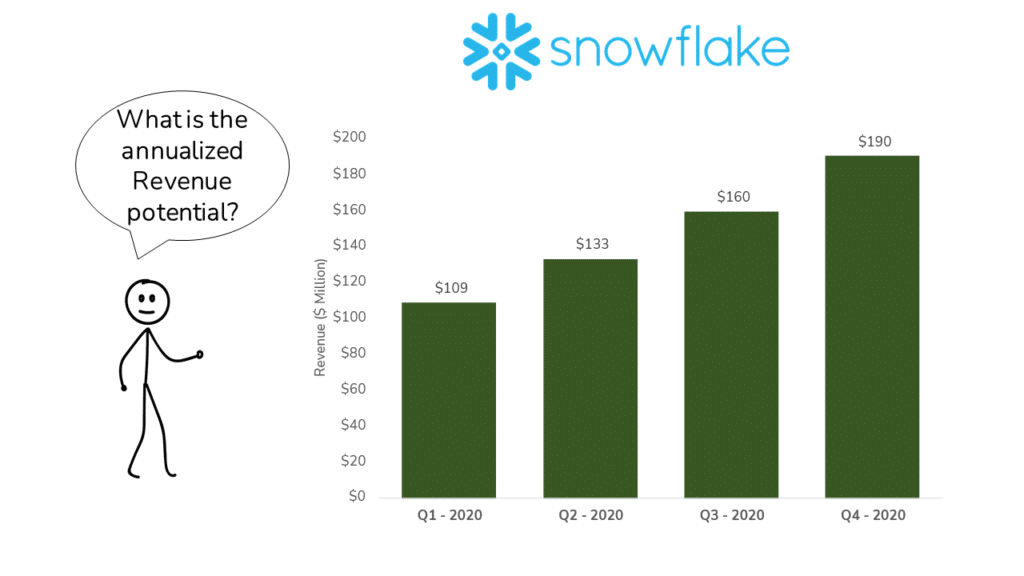
Let’s imagine we are analyzing Snowflake, a rapidly growing Software as a Service (SAAS), in early 2021.
The boss has asked you to estimate the potential Annual Revenue for Snowflake.
For Fiscal Year 2020, the Company’s Revenue grew 124% versus the prior year. Not bad at all!
But we need to see what Annualized Revenue would look like in 2021 if the Snowflake sustains Q4 Revenue levels.
In the Fourth Quarter of Fiscal 2020, the Company generated $190 million in Revenue.
To get to the Annual Run Rate, we would multiply Q4 Revenue by four.

If Snowflake were to sustain its Q4 level of Revenue, the Annualized Revenue (i.e. Run Rate) would be $762 million (nearly 30% higher than the Last Twelve Months of performance).
As you can see, the Annual Run Rate estimate is quite different from full-year 2020 Revenue of $592 million.
In the First Quarter of 2021 alone, Snowflake generated $230 million in Revenue (a new Annual Run Rate of $920M).
In both Q4 2020 and Q1 2021, the Annual Run Rate was far different than the most recent year of performance.
As you can see in this example, when a Business is experiencing dramatic growth, Run Rates are often more helpful than historical numbers.
With that said, Revenue Run Rate calculations do have a few shortcomings, which we address in the next section.
Pitfalls with Revenue Run Rate Calculations
In the words of Yogi Berra, ‘It’s tough to make predictions, especially about the future.’
When we calculate Annual Run Rate Revenue, we assume that the future will look exactly like the period we use to make the Run Rate calculation.
If the Business experiences circumstances that are different in the future, the Run Rate calculation will fall apart.
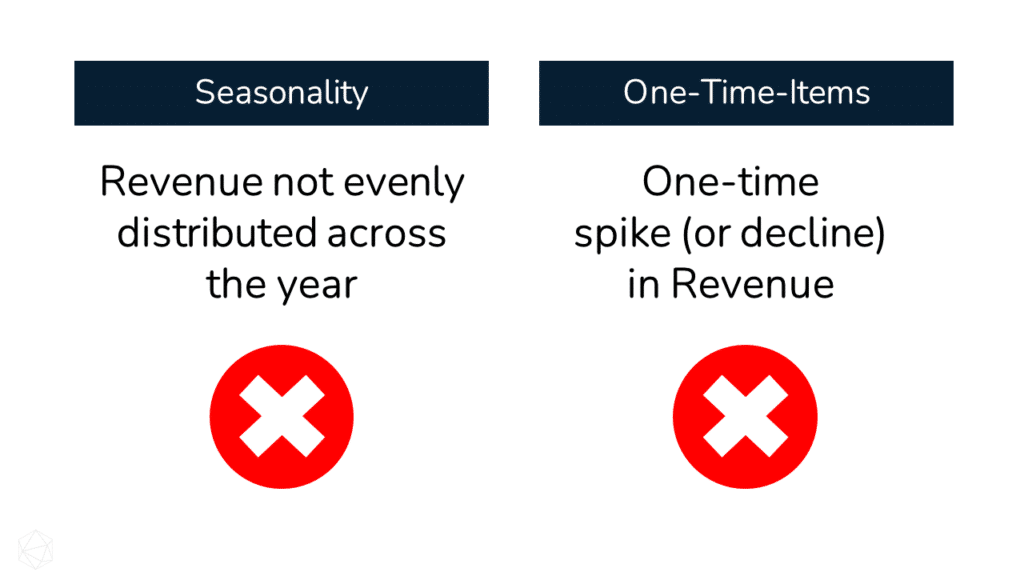
Below, we cover two examples of where Run Rate calculations do not work: Seasonality and One-Time Items.
Run Rate Revenue Pitfall #1: Seasonality
Some Businesses experience seasonal fluctuations (or Seasonality).
Below are a couple of examples:
- Retail: Large portion of Revenue during the holidays (fourth calendar quarter).
- Tax Providers: Large portion of Revenue during the tax season (second calendar quarter in the US).
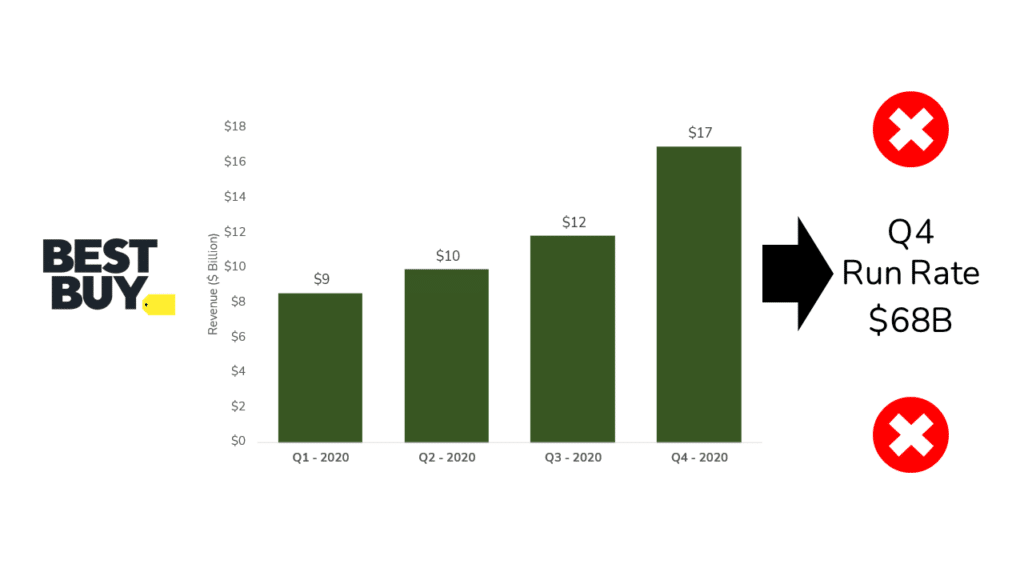
With these Businesses, you cannot just annualize a single Quarter. If you do, the Run Rate will misrepresent the full-year performance, as you can see below with Best Buy.
Best Buy’s full-year revenue in 2020 was only $47 billion.
A Run Rate based on Best Buy’s Fourth Quarter in 2020, would result in estimated revenue of $68 billion.
We’re not even in the ballpark!
Run Rate Revenue Pitfall #2: One-Time Items
Nearly any Business will experience ‘One-Time’ or ‘Non-Recurring’ Events.
For example, at the outset of the pandemic, Puzzle Warehouse, the world’s largest puzzle company, experienced a significant spike in Revenue because everyone stayed at home.

Clearly, this type of Revenue is one-time in nature.
Therefore, you should avoid using Run Rate calculations to annualize results for companies experiencing a one-time event like this.
Next, we will look at a few everyday situations where Run Rate is used in practice.
Other Run Rate Applications: SAAS ARR and EBITDA
Beyond Revenue, there are many other uses of Run Rate calculations across the Buy Side and Sell Side in Finance.
In the sections below, we cover the following Run Rate Calculations:
- SAAS Annual Recurring Revenue (ARR)
- Run Rate EBITDA
Alternative Run Rate Example #1: SAAS ARR
Over the last decade, software companies like Adobe and others have moved to recurring subscriptions instead of one-time license sales.
Technology businesses taking this approach are called Software as a Services (or ‘SAAS’).
The subscriptions they offer are recurring in nature, which provides visibility into future Revenue.
As a result, SAAS Businesses often use a metric called Annual Recurring Revenue (ARR).
The ARR calculation shows the Annual Run Rate of monthly subscription revenues. ARR helps operators and Investors understand annual Revenue potential of the Business.

Alternative Run Rate Example #2: Run Rate EBITDA
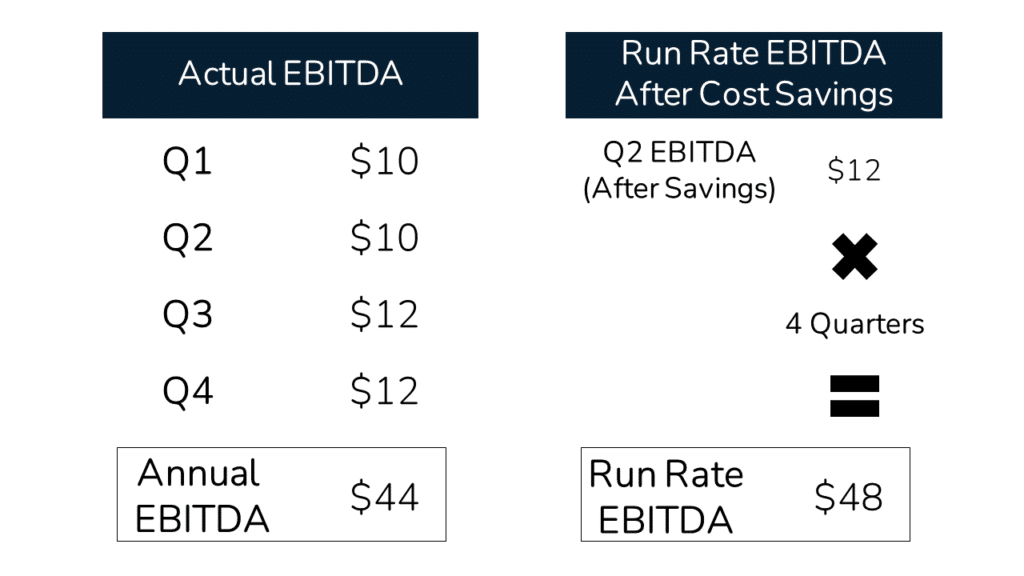
Let’s imagine it’s six months after a Leveraged Buyout purchase by a Private Equity firm. And the Investors implement a cost savings initiative.
Let’s also say that EBITDA was $10 million per Quarter in Q1 and Q2 of the current year.
But, after the cost savings, the new quarterly EBITDA is $12 million per Quarter.
For the full year, the Business will generate Actual EBITDA of $44 million, but this does not capture the full annual potential EBITDA of the Business.
The full potential is the Run Rate EBITDA of $48 million, as you can see below.
In addition to Private Equity, Run Rate EBITDA is also widely used in Investment Banking to show a ‘normalized’ version of EBITDA when selling a Business.
Wrap-Up: Revenue Run Rate
Hopefully, you now have a much better grasp of the Revenue Run Rate Calculation. And also the underlying idea behind the Revenue Run Rate.
The Revenue Run Rate (and other Run Rates) are critical because they help us capture a Business’ potential Annual performance.
Let us know if you have any questions in the comments below. We’d love to hear from you!
About the Author

Mike Kimpel is the Founder and CEO of Finance|able, a next-generation Finance Career Training platform. Mike has worked in Investment Banking, Private Equity, Hedge Fund, and Mutual Fund roles during his career.
He is an Adjunct Professor in Columbia Business School’s Value Investing Program and leads the Finance track at Access Distributed, a non-profit that creates access to top-tier Finance jobs for students at non-target schools from underrepresented backgrounds.
Frequently Asked Questions
For an Annual Run rate, you first find Financial data for a recent time period that you would like to use to estimate potential annual performance. Second, determine the number of times that period occurs within a year (e.g. 4 for Quarterly, 12 for Monthly). Third, multiply the number of occurrences per year by your financial metric (Revenue, EBITDA, etc.) to arrive at the Annual Run Rate.
Run Rate reflects extrapolated performance (usually for a full year) based on performance during a recent period of time.
The Run Rate reflects estimated performance based on a recent period’s performance.
Run Rate reflects extrapolated performance based on EBITDA performance during a recent period of time.
