The Paper LBO, a full LBO analysis completed with pen and paper, is an increasingly common question in Investment Banking and Private Equity interviews. Understandably, the thought of doing mental math on the spot and walking through an entire LBO analysis is intimidating. But Paper LBOs do not need to be such a scary prospect.
In this guide, we will walk you through the common variations of Paper LBOs (+ Mental Math tricks) to help you nail this question and get the job!
In this article, you will learn:
- The Basics of Paper LBO Interview Questions (typical prompt, most common variations, timing, interviewer goals).
- The most Common Pitfalls when working through a Paper LBO.
- The Critical Mental Math Hacks needed to fly through these Interview Questions.
- The 5 Step Process to nail the core Paper LBO (solving for IRR).
- A separate 5 Step Process to master the Reverse Paper LBO (solving for required EBITDA Growth based on Target Return).
Estimated reading time: 78 minutes
TL;DR
- A Paper LBO requires an Interview Candidate to walk through a full LBO analysis with just Pen and Paper (no calculator allowed).
- The Paper LBO can be a daunting Interview Question but can be mastered with a 5 Step Process.
- Mental Math shortcuts are essential to mastering Paper LBO questions.
A Little Context on the ‘Paper LBO’
Just the mention of a Paper LBO question can strike fear in the hearts of aspiring Investment Banking and Private Equity candidates.
And it is no surprise that’s the case!
LBO Mechanics + Mental Math + Lots of Moving Pieces + Numerous Variations = Lots of Stress
We cannot eliminate all of the stress involved in a Paper LBO, but we can help you massively reduce it.
Before we jump ahead, it is worth mentioning that Paper LBOs are not just an Interview Question.
Private Equity and Investment Banking professionals use these ‘back of the envelope’ calculations every day on the job to quickly assess the attractiveness of an LBO transaction.
Now let’s dive into what a Paper LBO typically looks like in real life.
Want To Learn More About Finance?
Check out all of our (free) deep-dive articles in our Analyst Starter Kit:
What is a Paper LBO?
A Paper LBO is an Interview Question in which the Interviewer asks you to complete an entire LBO analysis with just pencil (or pen) and paper.
In most cases, you are not allowed to use a calculator. Instead, you must do all of the math in your head.
Most Paper LBOs must be completed in 10-15 minutes.
And Interviewees must write out and show all of their calculations.

For most candidates, the two scariest aspects of the process are:
- On-the-spot Mental Math
- Mixing up LBO model mechanics
But there are a few Mental Math tricks that you can use to mitigate most of the stress with Item #1 above.
For Item #2, we will provide a simple, 5 Step framework to keep you anchored when working through these problems.
We have now covered the basics of Paper LBOs. Let’s quickly clarify the difference between the Paper LBO and another common LBO-related Interview Question.
Paper LBO vs. Walk Me Through an LBO
Before we dive in here, we must clarify a common point of confusion.
A common question around Paper LBOs is how they differ from the ‘Walk Me Through an LBO’ Interview Question.
The big difference between these two questions is that you are typically not working through LBO calculations on the spot with ‘Walk Me through an LBO.’

With ‘Walk Me Through an LBO,’ an interviewee typically only provides a high-level overview of the LBO process.
If you are new to LBOs and preparing for interviews, we recommend checking out our ‘Walk Me Through an LBO’ deep-dive article.
With that point clarified, let’s look at what interviewers when job candidates work through a Paper LBO.
What are Interviewers Looking For?
When an Interviewer asks you to complete a Paper LBO, they are testing you on a few factors.
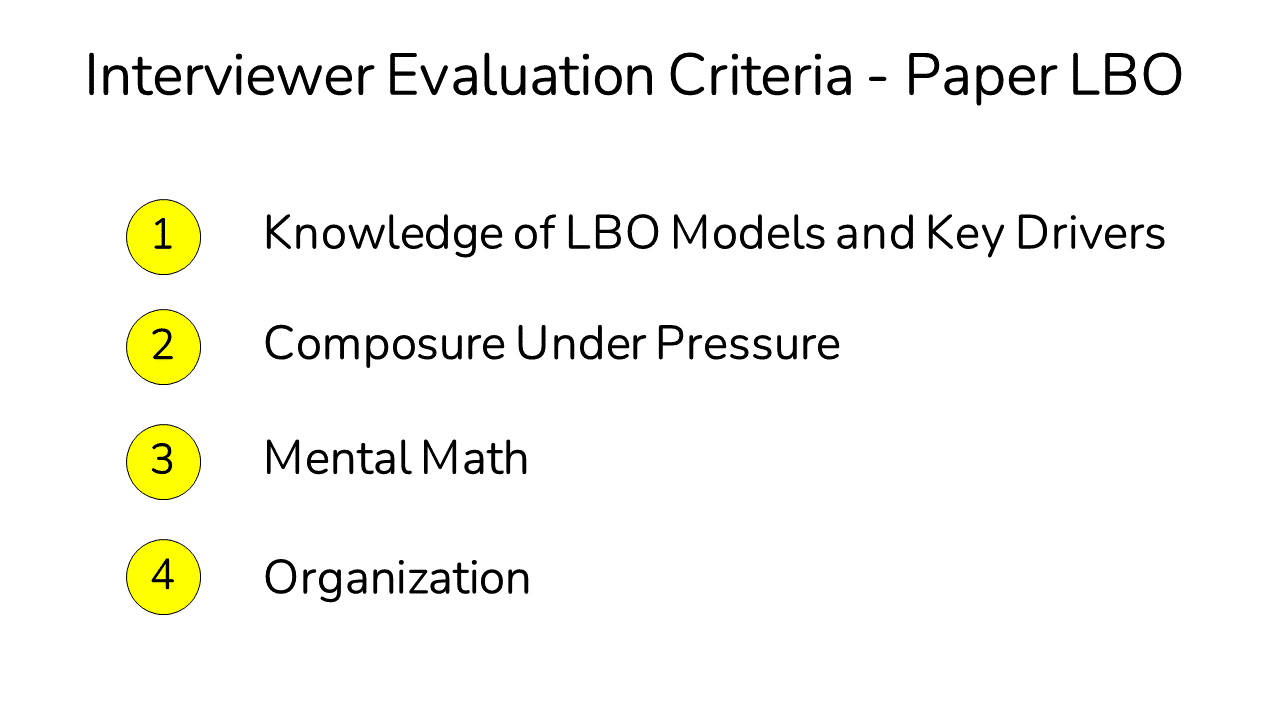
The items below are the core items interviewers are testing:
- Knowledge of LBOs (and Key Drivers): Do you have a strong understanding of an LBO model’s mechanics, key steps, and underlying drivers?
- Composure Under Pressure: Can you keep your cool while working through a tricky problem with someone looking over your shoulder?
- Mental Math: Can you quickly work through various mental math calculations without getting tripped up?
- Organization: Can you keep all of the bits and pieces organized when working through this problem?
You will be in great shape if you exhibit all four factors above and complete the exercise with accuracy!
If you fumble on any of the four, you will have difficulty landing the job, particularly in Private Equity.
With those points covered, let’s look at common pitfalls when answering Paper LBO questions.
5 Common Paper LBO Mistakes (and Solutions)
There are five common mistakes to avoid when working through a Paper LBO problem in an interview.
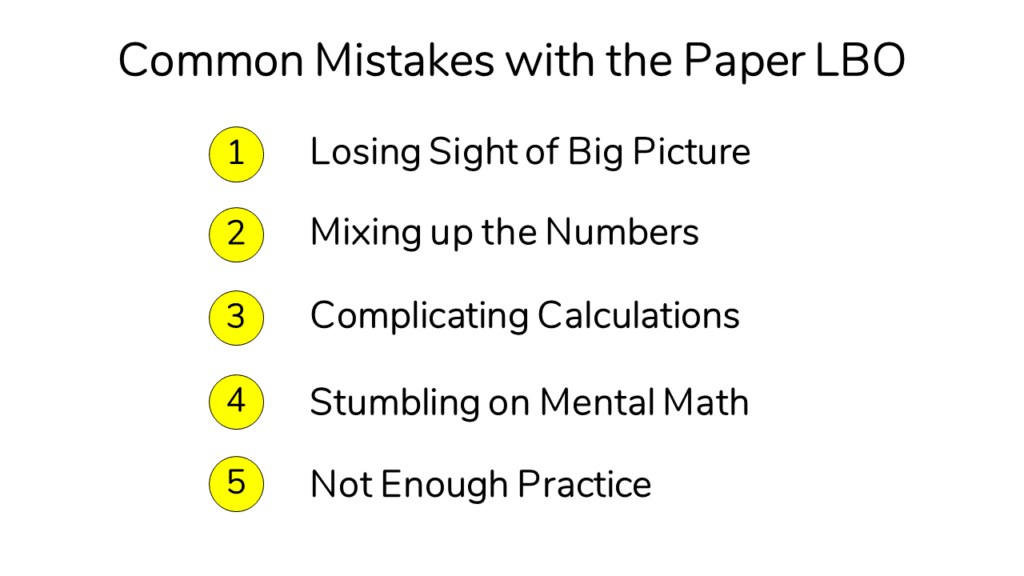
Mistake #1 – Losing Sight of the Big Picture
There are many moving pieces in an LBO model, and it is easy to get lost.
Solution: To avoid getting lost, you need a ‘North Star.’ Your North Star is the 5 Step Process laid out below for a Paper LBO. Whenever you get lost, always anchor back to the framework.
Mistake #2 – Mixing Up Numbers in Your Analysis
Even with a solid grasp of the big picture, you will need to manage numerous details during a Paper LBO.
Solution: The key here is to keep your work as neat as possible. If you try to write everything out too quickly and have sloppy handwriting, you are bound to mix up your numbers.
Mistake #3 – Complicating Calculations
In a Paper LBO exercise, interviewees often feel they need to be incredibly precise with their calculations.
Unnecessary complexity or precision in a Paper LBO exercise is your archenemy.
This desire for precision leads to extra information you have to manage, which in turn leads to getting stuck in your calculations.
Clearly, calculation errors are never OK in a Paper LBO. However, you do not need to calculate every number to the third decimal place.
Solution (Part 1): The first thing to note is that you should round numbers wherever possible.
For example, let’s say we need to calculate 10% Revenue growth on $121 of Revenue.
The exact answer is: $121 * 1.1 = $133.1.
But in a case like this, it’s entirely acceptable to round to $133.
Solution (Part 2): With any set of calculations in the Paper LBO process, you should always look for ways to reduce the number of calculations (and thus your mental load).
All else equal, the more calculations you make, the more likely you are to make a mistake.
For example, when a prompt assumes constant Revenue Growth, you can shortcut the number of calculations by simply growing any item that will remain at a constant Percentage of Sales by Revenue Growth.
We show an example of this trick later in the article.
Mistake #4 – Stumbling on Mental Math
The thought of performing numerous quick calculations in your head during an Interview is understandably intimidating.
Solution: Mental Math, when performed well, can look like magic to an outside observer. But no, most people in Finance are not human calculators.
Rather most Finance professionals learn a set of Mental Math shortcuts (listed above) to make mental calculations quickly.
This article will help you to shortcut that process and learn those tricks now.
Mistake #5 – Not Enough Practice
It is not enough to complete one or two Paper LBO practice problems before an interview.
Solution: You should practice working through Paper LBOs as many times as possible (ideally ten times or more).
As you work through additional problems, you will begin to see the common threads as well as the shortcuts that permeate most Paper LBO questions.
Learning these things can help you go on autopilot for stretches of the exercise to give your brain a break (or allow for background processing of an upcoming problem).
In short, Practice!
Now that we have covered the common pitfalls let’s carry on to the most common Paper LBO Variations.
Enjoying the Article?
Check out our LBO Modeling Course.
Common Variations of the Paper LBO
Before we dive into our first Paper LBO example, we must clarify a few common variations of Paper LBO problems.
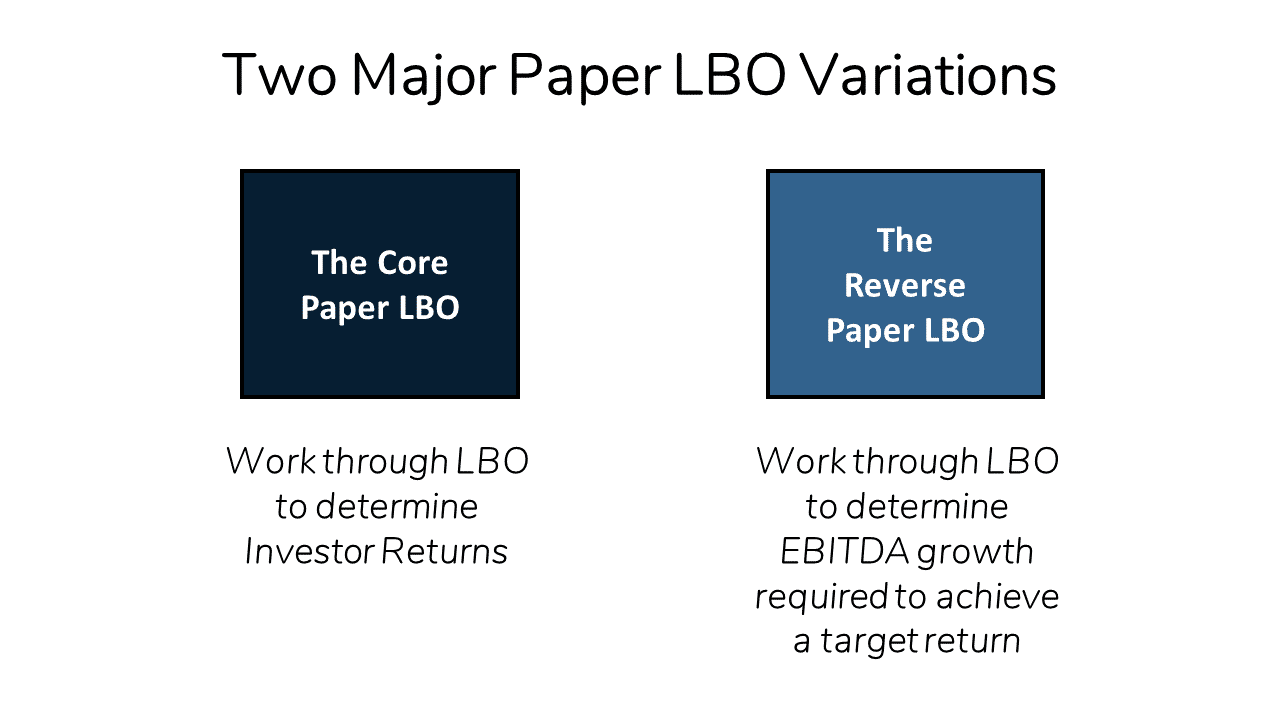
Below are the most common Paper LBO variations you are likely to encounter:
- The Core Paper LBO:
- Includes all necessary assumptions
- Assumptions are constant over the projection period
- Purchase Price based on LTM EBITDA
- Only one layer (‘tranche’) of Debt
- Solve for IRR
- The Reverse Paper LBO:
- Reverse engineer the Core Paper LBO to determine the level of EBITDA growth required to achieve a Targeted IRR.
You may encounter more advanced variations (NTM Multiples, Multiple Debt Tranches, Debt Amortization, Assumptions that Vary over the Projection Period, etc.) to the Paper LBO, which we will cover in future iterations of this article. (see more here)
To begin here, we will focus on the Core Paper LBO, which is the version you are most likely to see in an Interview.
Let’s dive in!
The Paper LBO in 5 Steps
To work through a Paper LBO, we’ll use the following 5 Step Process:
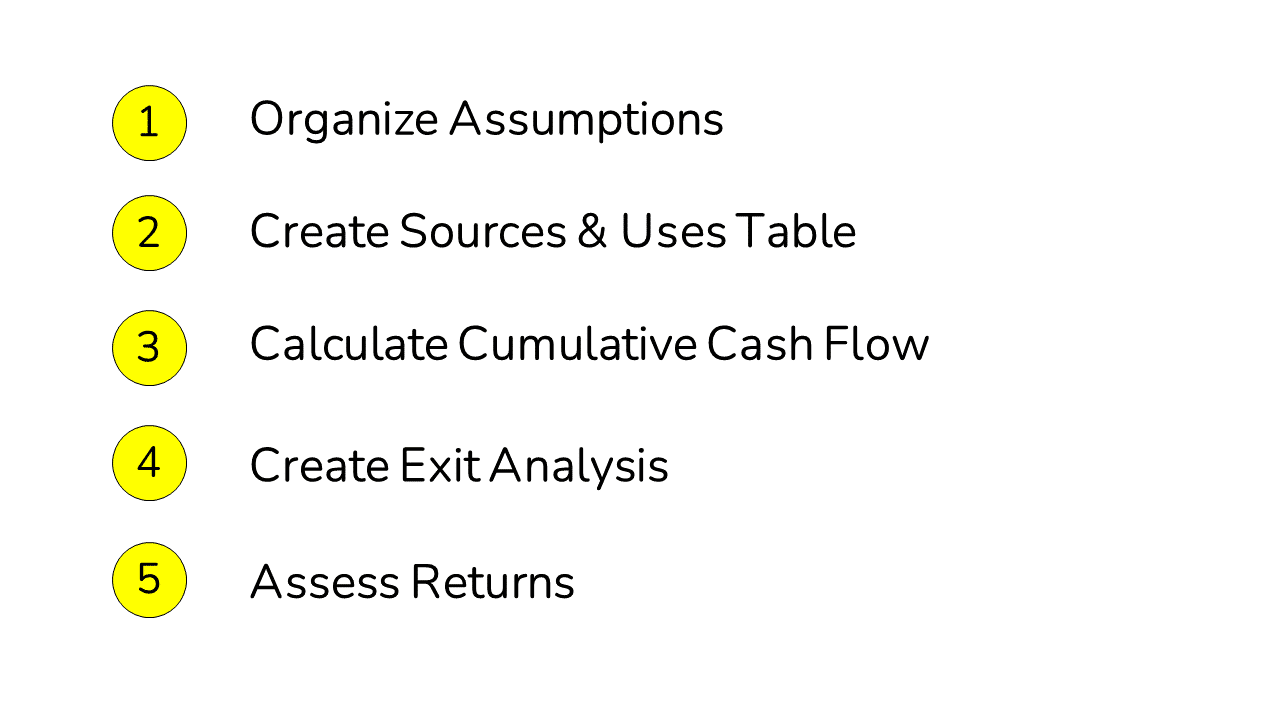
- Organize Assumptions
Organize given assumptions by category. The key here is to have a system to track which pieces of data you have and what is missing (if anything).
- Create Sources & Uses Table
Create a table to work from Purchase Price (Enterprise Value) to Debt Funding, and ultimately to the ‘Sponsor Equity’ Investment (i.e., the money the Private Equity Firm will need to contribute).
- Calculate Cumulative Cash Flow
Work from EBITDA to the Levered Free Cash Flow for each year to determine the cumulative Cash Flow that will be used to pay down Debt.
- Create Exit Analysis
Calculate Exit Sale Value and work to Exit Equity Proceeds.
- Assess Returns
Calculate the Multiple of Invested Capital (MOIC) and approximate Internal Rate of Return (IRR) from the Deal.
Below, we will work through the 5 Steps above using sample a prompt based on examples of real-life Paper LBOs.
Core Paper LBO (Process + Example)
To help make this a little more tangible, we will walk through this question as if you were in the Interview.
We will imagine that you have landed an interview for your dream Private Equity role.
As we progress through the article, the Interviewer will add additional twists and turns to throw you off track.
And the first question the Interviewer asks after the initial ‘Tell Me About Yourself’ question is the following Paper LBO question.
The Paper LBO Prompt
To kick things off, the Interviewer shares the details below:
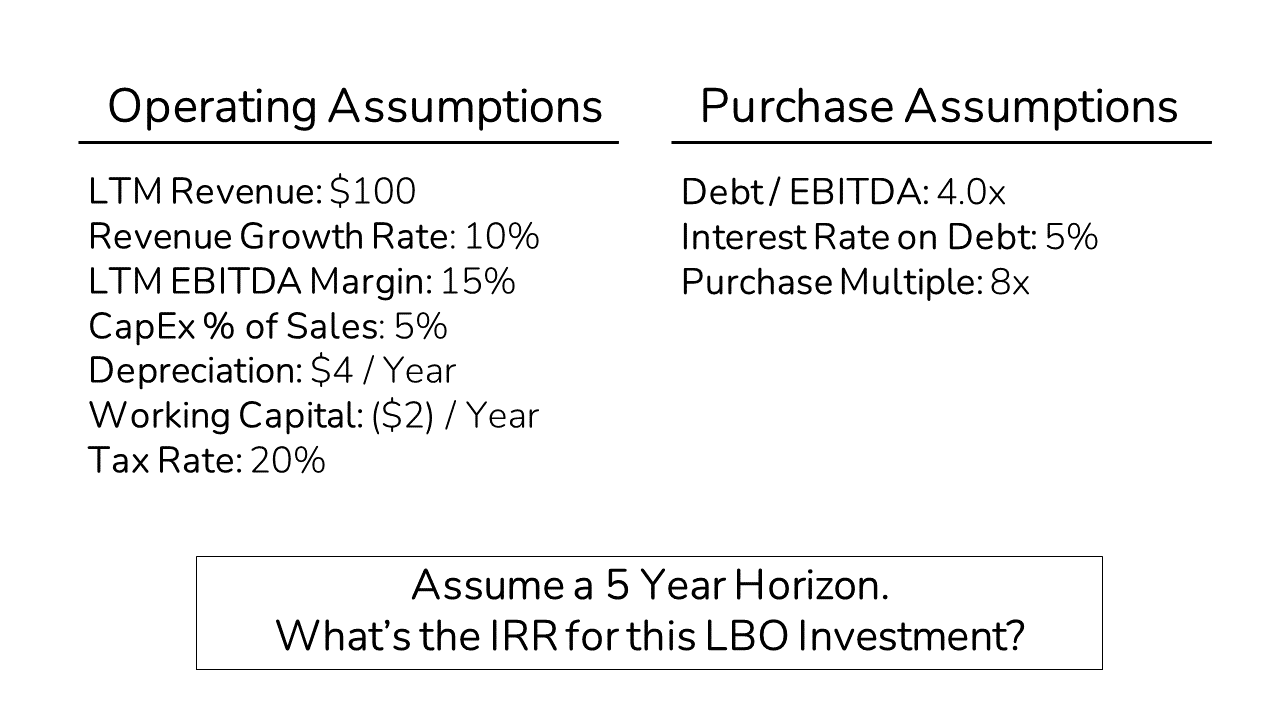
The Interviewer says you can assume that the Purchase Multiples will be based on LTM EBITDA. And that you should assume no Debt is paid down until Exit.
Let’s jump ahead and see how we can tackle this.
Paper LBO Step #1: Organize Assumptions
First of all. Holy moly! That’s a lot of information!
Let’s start by getting organized.
Below are the critical items we will need for the Core Paper LBO the relevant categories to help you stay organized.
Let’s organize the provided data into the relevant categories above to ensure we have everything we need.
To help you keep track of the major categories, you can use the PD-REIT-CDN mnemonic:
- Purchase Price & Debt Funding Details (‘PD’ or ‘Police Department’)
- Revenue, EBITDA, Interest, Taxes (‘REIT’ or ‘Real Estate Investment Trust’)
- CapEx, D&A, and Net Working Capital (‘CDN’ or ‘Canadian Currency’)
You’re laughing! We get it.
It is a funny shorthand, but it will ease the mental burden of completing your Paper LBO and make sure you don’t miss anything!
Now let’s fill in the missing pieces based on the information provided.
Purchase Price and Debt Funding
With the information provided, we can now determine the Purchase Price and Debt Funding
As we noted in our Walk Me Through an LBO article, we calculate purchase in the Private Equity world with EBITDA * EV/EBITDA Multiple.
The Interviewer provided the Purchase Multiple of 8.0x, but we still need EBITDA to calculate Purchase Price.
To arrive at EBITDA, we’ll multiply the provided Revenue of $100 * EBITDA Margin of 15%.
We have $15 of EBITDA, so our Purchase Price will be $120 ($15 EBITDA * 8.0x EV/ LTM EBITDA).
Now, we can move on to Debt Funding.
Debt is typically expressed as a multiple of LTM EBITDA in the LBO world.
We were told that the Funding would be 4.0x Debt / EBITDA in the prompt.
We have $15 of EBITDA, so our Debt Funding will be $60 ($15 EBITDA * 4.0x Debt / LTM EBITDA).
Now that we have organized our Assumptions, we will create our Sources and Uses table.
Paper LBO Step #2: Create Sources & Uses Table
The Sources and Uses table for a Paper LBO typically contains very basic:
- Purchase Price of the Target
- Debt and Equity Funding
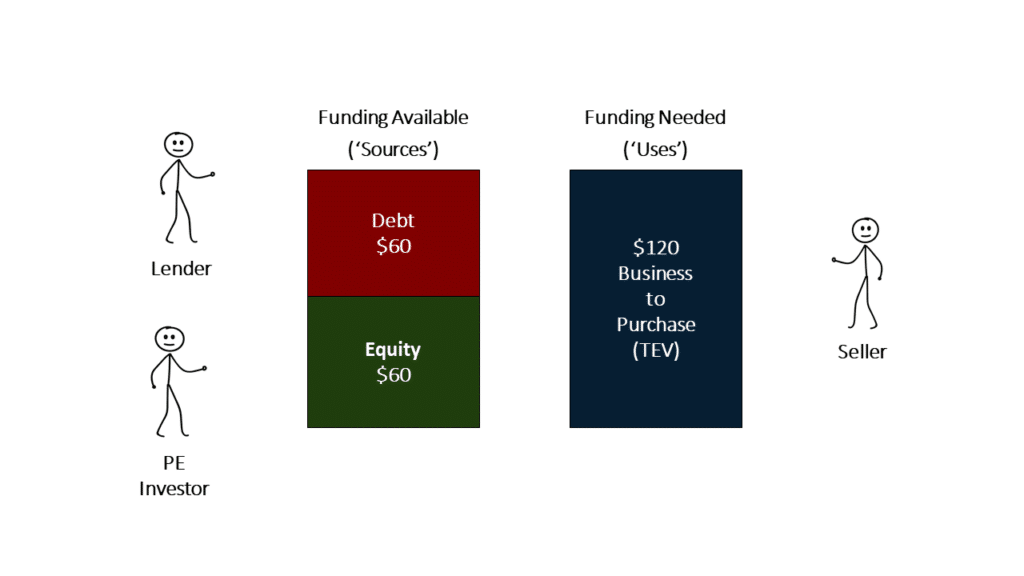
When working through this step, always start by figuring out Uses first (in this or any LBO exercise).
In other words, first, figure out how much money you need to come up with to buy the Business. Then figure out how you will pay for it.
Our only ‘Use of Funds’ in the Core Paper LBO problem is the Purchase Price of the Business.
In the prior step, we said that the Purchase Price of the Business (Enterprise Value) is $120.
So we will need to come up with $120 using a combination of Debt and Equity funding.
Leveraged Buyouts are first funded with Debt. The Private Equity firm covers the rest of the Purchase Price.
In the prior step, we determined that we needed $120 of total Funding to Purchase the Business and we said that Lenders would offer us $60 of Debt.
The difference is what the Private Equity Fund will need to contribute (also called ‘Sponsor Equity’).
So as the Private Equity Investor, we must come up with $60 of Funding ($120 Purchase Price – $60 of Debt Funding).
Note that the Private Equity funding amount is often called the ‘Plug,’ because it funds the gap between the Purchase Price and any Debt in an LBO transaction.
With the Sources and Uses completed, we will now calculate the Cash Flow Generated by the Business over the five-year projection period.
Paper LBO Step #3: Calculate Cumulative Cash Flow

First, we need to clarify what Cash Flow we are calculating here.
Broadly speaking, there are two types of Cash Flow: Levered and Unlevered.
In a standard Discounted Cash Flow analysis, we typically calculate to Unlevered Free Cash Flow because we want to value the Business as a whole (i.e. ‘Enterprise Value’), absent the impact of Debt.
In an LBO analysis, however, we are looking at everything from the value attributable to the Equity Investor (a Private Equity firm in this case).
And Equity Value sits below Debt in the capital hierarchy.
As a result, we look at Levered Free Cash Flow, which incorporates the impact of Debt.
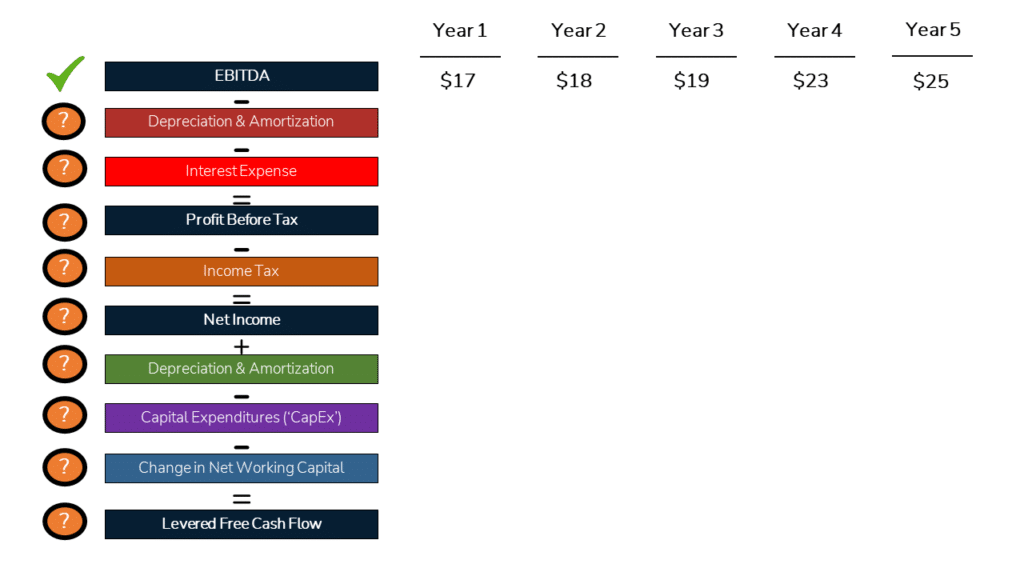
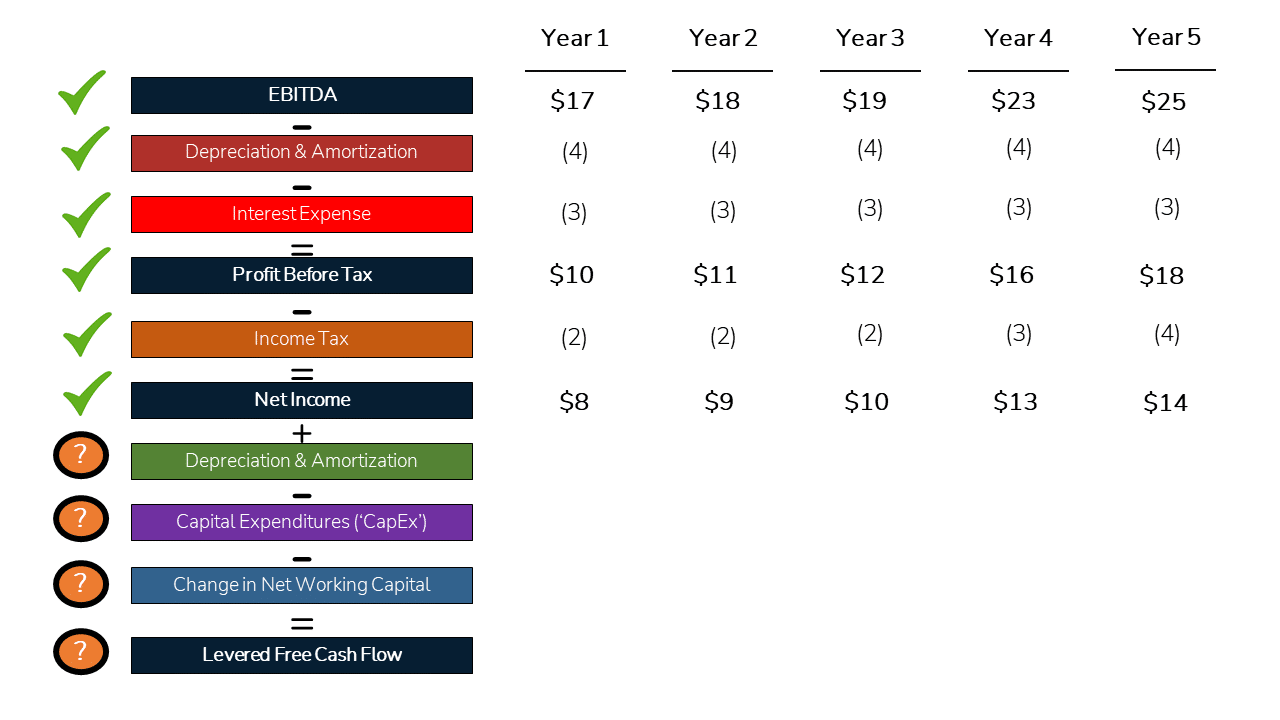
To calculate to Levered Free Cash Flow, we will typically follow the path laid out below:
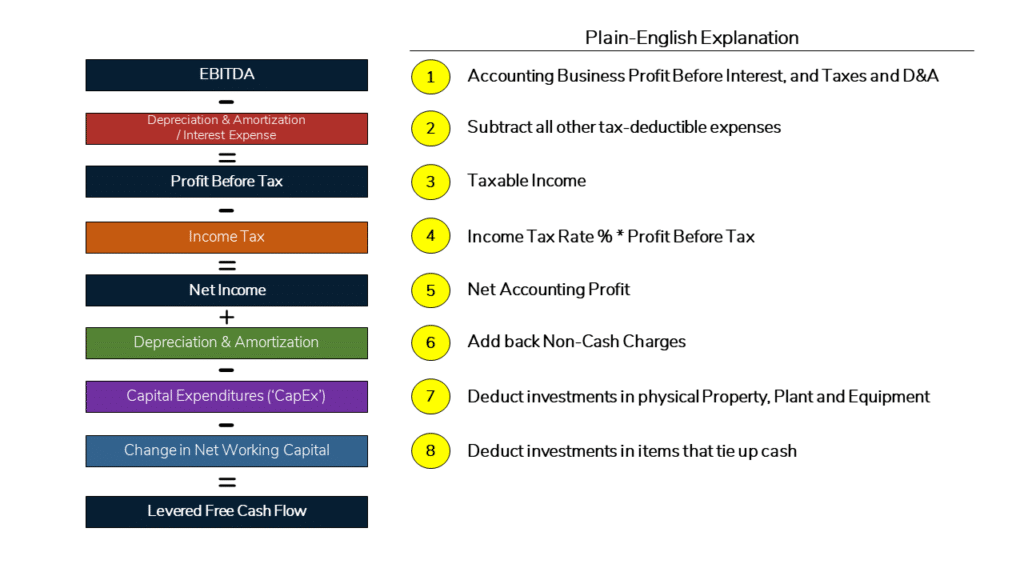
Now that we have laid out the path to Levered Free Cash Flow, we will work through each item one-by-one.
Before we begin, we need to review a few Mental Math Shortcuts that will help us to fly through this exercise.
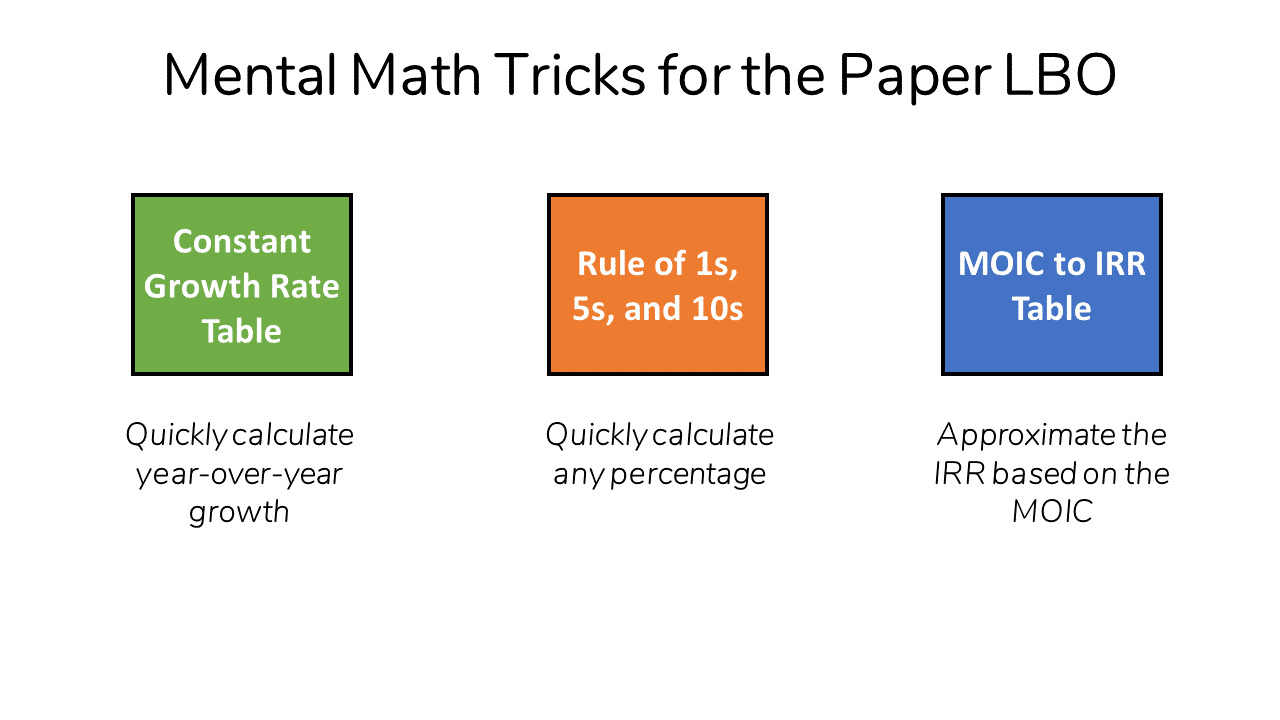
A Few Mental Math Shortcuts
Mental Math Hack #1: Constant Growth Rate Tables
When we have constant growth rates in a Paper LBO, we can simplify growth calculations by using the rules of thumb below.
First, most LBO deals involve later-stage companies with growth below 15% per year, so we’ll focus on calculating Revenue growth from 0-15%.
Further, Paper LBO prompts often utilize even numbers (e.g., 5%, 10%, etc.).
So you can memorize the growth factors for five years of growth at typical growth rates to help you complete a Paper LBO.
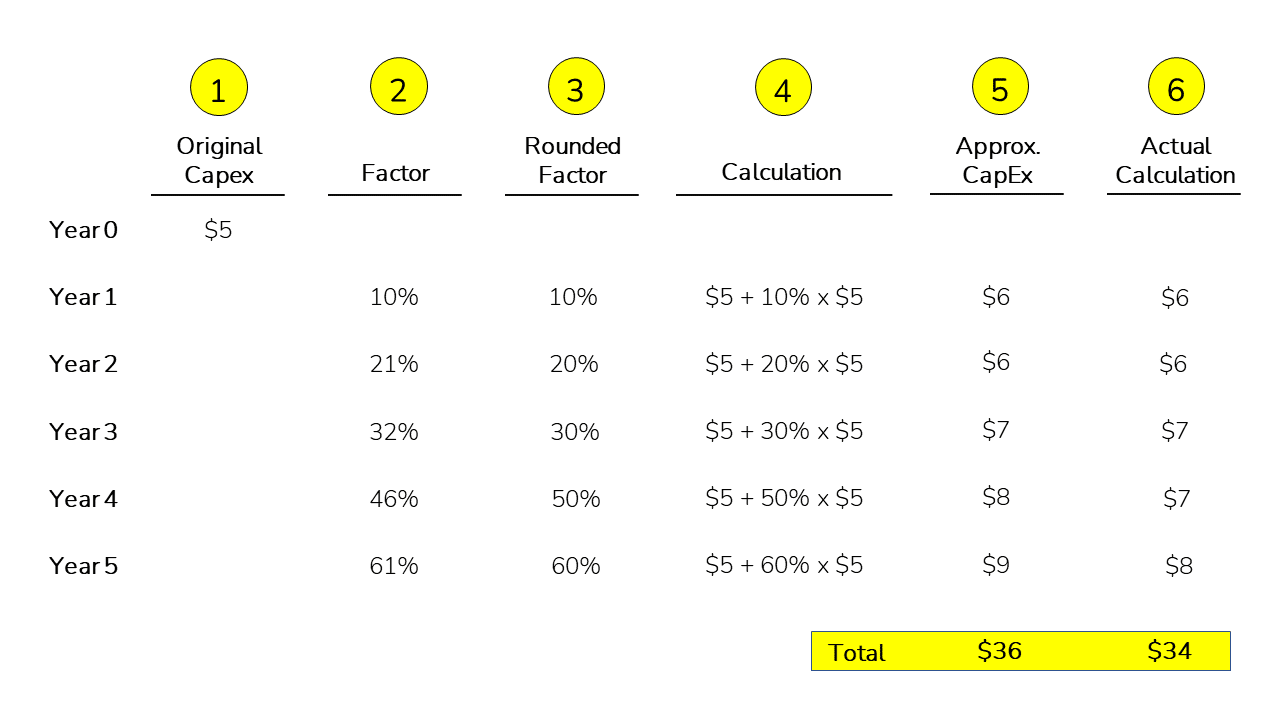
As you will see shortly, you can use percentages in the tables below with the original (Year 0) Revenue to quickly assess Revenue in each year.
At the very least, we strongly recommend memorizing the 10% Annual Growth factors below because that growth rate is relatively common.
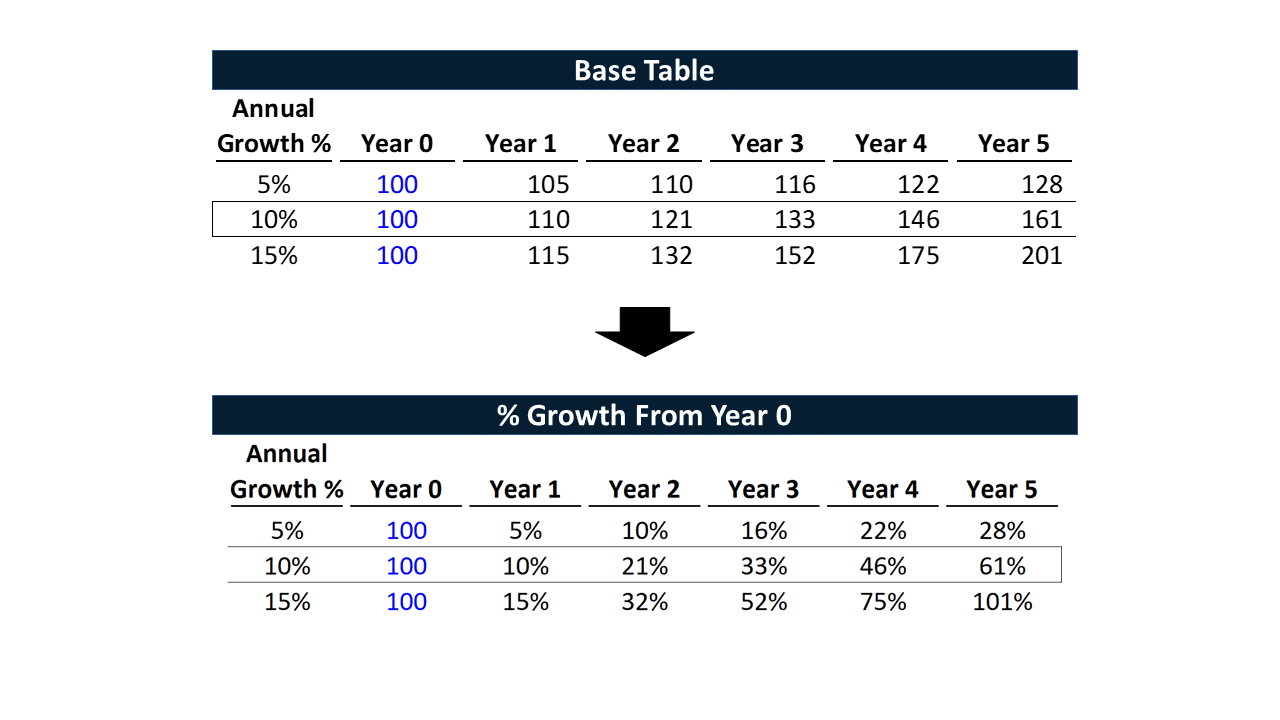
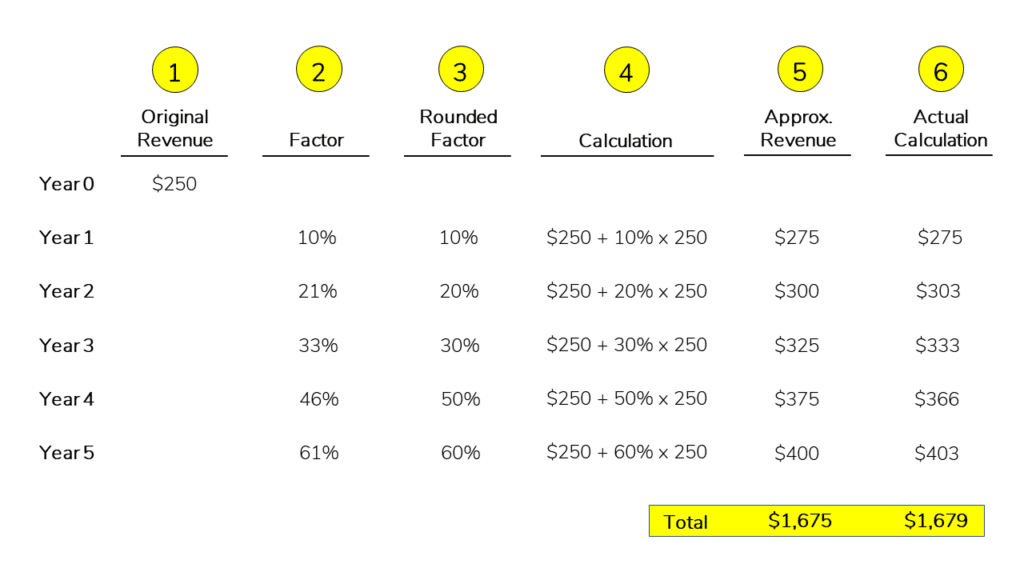
Now, instead of manually calculating each year’s Revenue, we simply apply the ‘Rounded Factor’ Growth % in each year to the Original (‘Year 0’) Revenue.
As you can see above, the cumulative Revenue with this approximate approach is incredibly close to the actual calculation.
Let’s now try something a bit more complicated.
Let’s say Revenue starts at $250.
If we know the factors, we can complete quick percentage calculations to get to Revenue for each year.
Another Constant Revenue Growth Shortcut
There’s yet another trick to keep in mind when we have a constant Revenue Growth Rate assumption.
Constant Revenue growth allows us to reduce the number of calculations we need to make in a Paper LBO.
If we use our Constant Growth Rate tables above, we could calculate Revenue for each year and then EBITDA and Capital Expenditures; we would need to make 15 calculations.
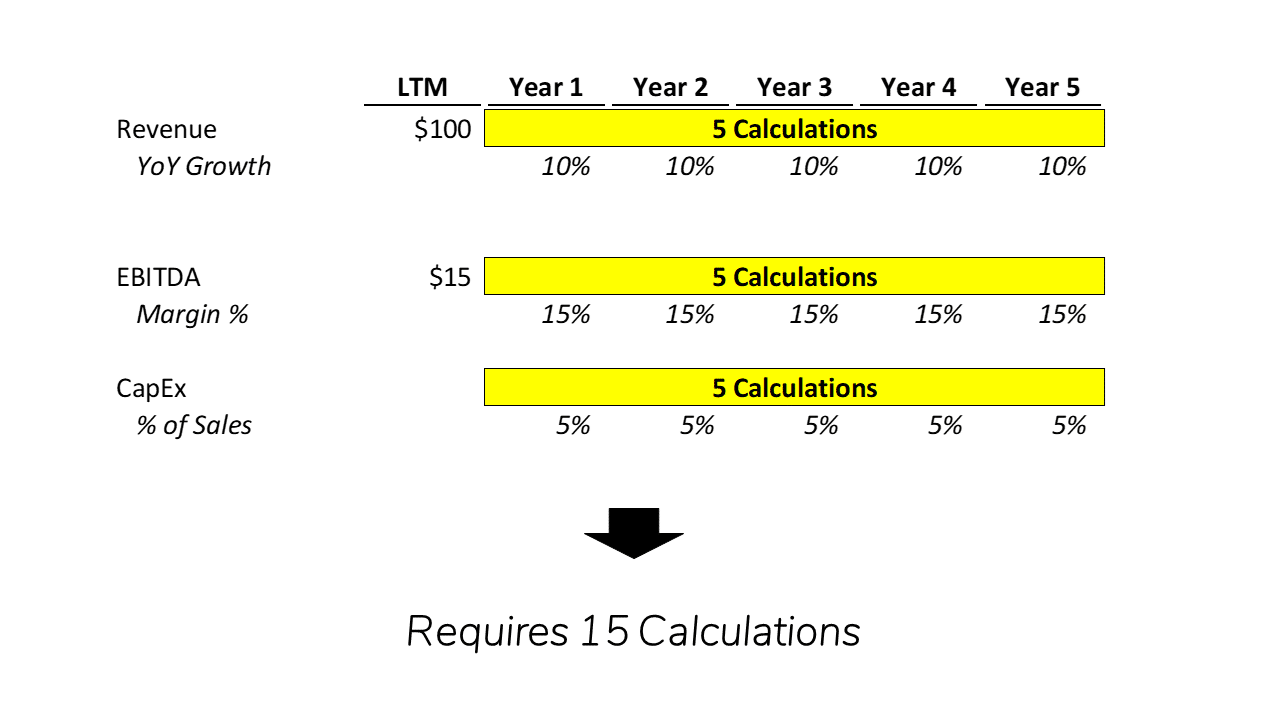
However, for any item that stays at a constant percentage of Revenue, the growth of that line item will grow in line with Revenue Growth.
Since EBITDA and Capital Expenditures remain constant as a percentage of sales, they will simply grow in line with the rate of Revenue Growth.
As a result, we can skip calculating Revenue altogether and use the Constant Growth Rate Factors above to grow EBITDA and Capital Expenditures in our Levered Free Cash Flow calculation.
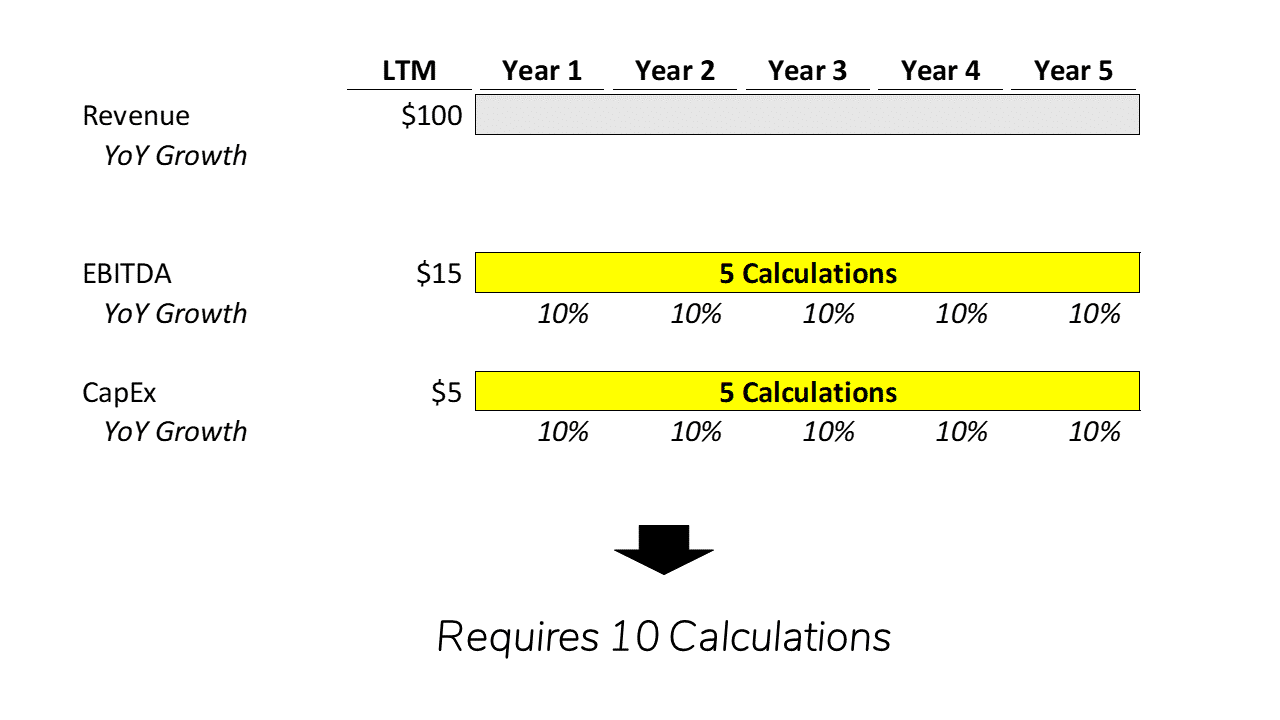
As you can see above, we can still calculate the EBITDA and Capital Expenditure value needed for the Paper LBO, but we eliminated five calculations in the process.
Now, let’s move on to the final Mental Math trick you should have in your toolkit for a Paper LBO exercise.
Mental Math Hack #2: Rule of 1s, 5s, and 10s

Let’s imagine you are in an interview.
You have been asked to complete the calculation in the image above as part of a Paper LBO exercise.
This doesn’t have to be a daunting task!
When working through percentage calculations, break down numbers into 1%, 5%, and 10% increments.
For example:
3% of any number is: 3 * 1%
15% of any number is: 1 * 10% and 1 * 5%
47% of any number is: 4 * 10% + 1 * 5% + 2* 1%
We can use this to our advantage when working through a Paper LBO (or any quick calculation involving percentages).
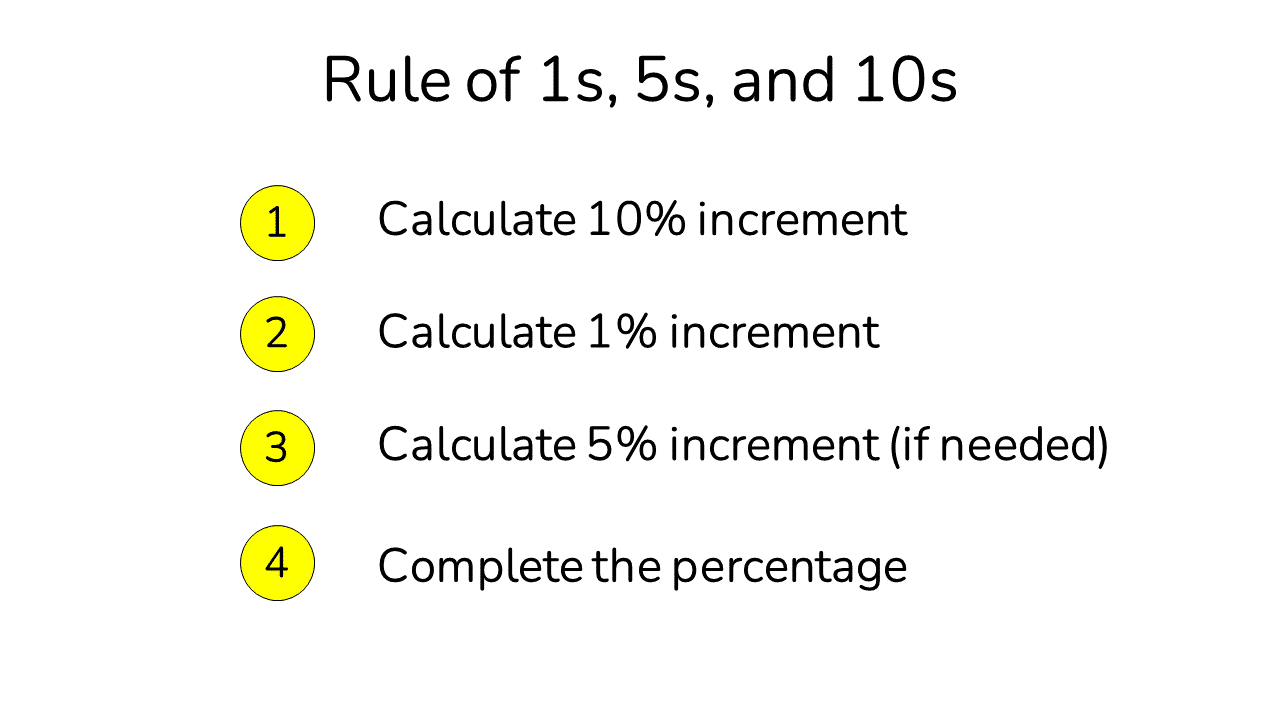
To work through the example above, we would:
- Calculate the 10% increment – move the decimal place. For example, 10% of $35 billion is $3.5 billion.
- Calculate the 1% increment – move the decimal place again. 10% of $3.5 billion is $350 million.
- If needed, calculate the 5% increment – divide $3.5 billion by 2 to arrive at $1.75 billion.
To begin with, 3 *$350 million = $1.05 billion.
We can then add $1.05 billion to $3.5 billion to arrive at $4.55 billion.
In short, you can create the building blocks to calculate any percentage using the Rule above.
Below are a few different examples of percentage calculations we could create using these building blocks as additional examples.
Now that we have covered the core Mental Math hacks you will need to complete this section, let’s work from Revenue to Free Cash Flow.
Revenue and EBITDA Projections
To kick things off here, we’ll need to project out Revenue.
The prompt stated that Revenue would grow at 10% over the time horizon.
As stated above, though, when we have constant Revenue growth, we can skip the Revenue calculation altogether as long as the operating assumptions in the model remain the same percentage of sales over the projections period.
We were told that the EBITDA Margin would remain constant at 15% over the projection period.
So, we can move down and calculate EBITDA using the Constant Growth Factors from above.

What if Revenue and EBITDA Margin Assumption Aren’t Constant?
If Revenue Growth or EBITDA margin varies over the projection period, you will need to use the Rule of 1s, 5s, and 10s.
And, as always, round where you can.
Calculate All Remaining Cash Flow Items
Now that we have calculated EBITDA, we need to work from EBITDA to Levered Free Cash Flow.
Below we’ve laid out the calculations for each item through to Levered Free Cash Flow.
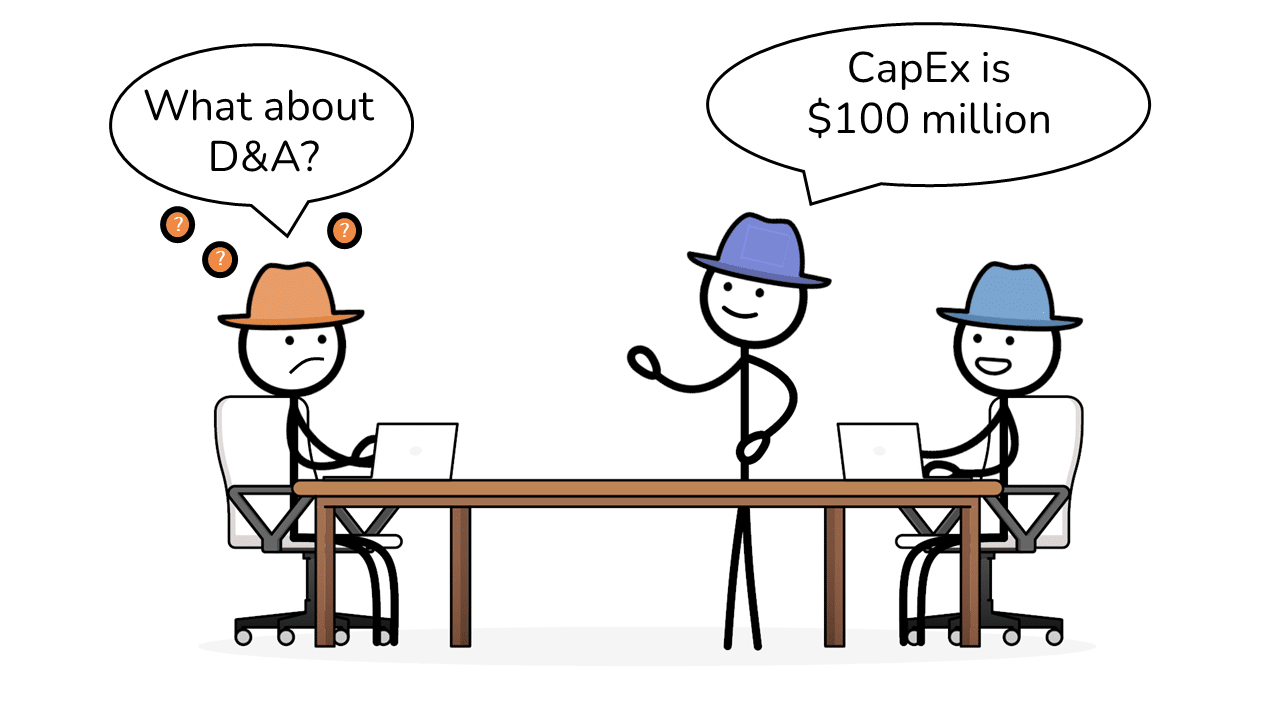
Depreciation and Amortization Expense
To begin with, we will need to deduct Depreciation and Amortization (‘D&A’) to get to Profit Before Tax.
Even though it’s a non-cash charge, D&A lowers the Company’s tax bill (via the ‘Depreciation Tax Shield’).
The Paper LBO prompt stated that Depreciation would be constant at $4 per year, which keeps things simple.
The image below reflects the deduction of D&A Expense.
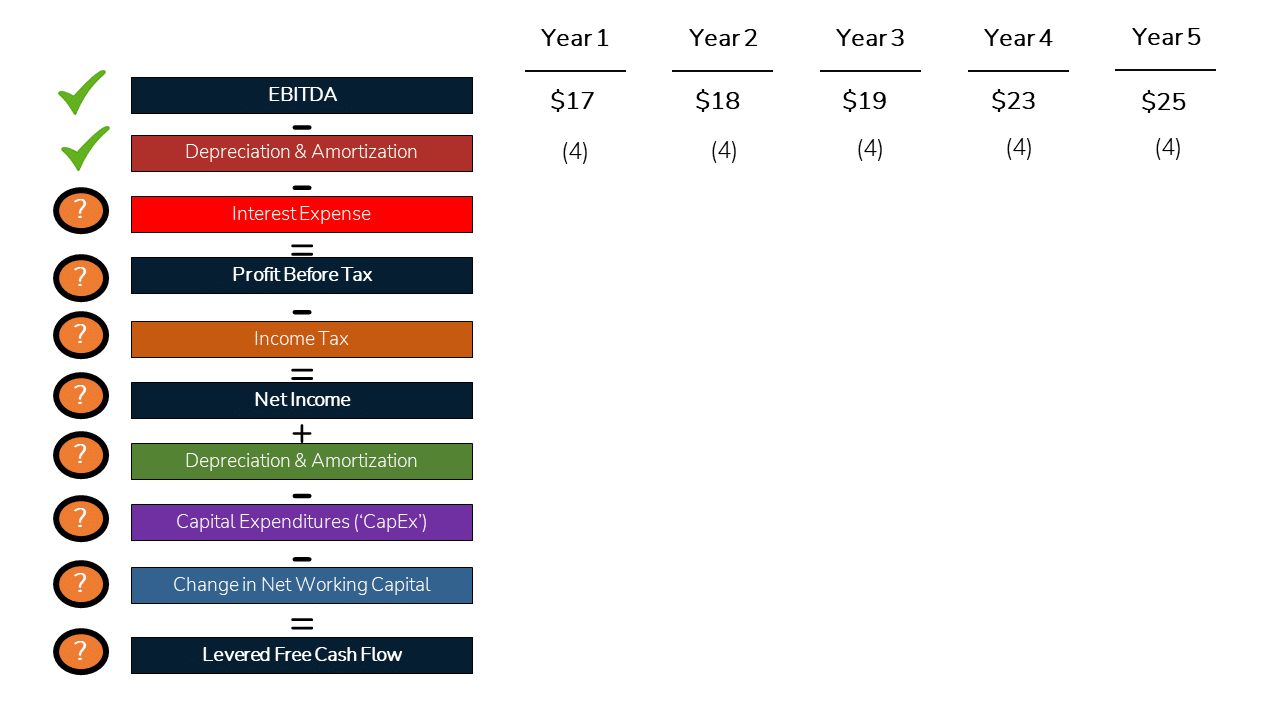
We have incorporated D&A into our Levered Free Cash Flow calculation and can move onto interest expense.
Interest Expense Calculations
In Step #1, we determined that Lenders would offer $60 of Debt funding.
Our Paper LBO prompt stated that the Interest Rate on Debt would be 5% and to assume no Debt paydown until the Sale of the Business.
As such, we will have a constant dollar value of Interest Expense each year.
Below is the quick calculation for Interest Expense:
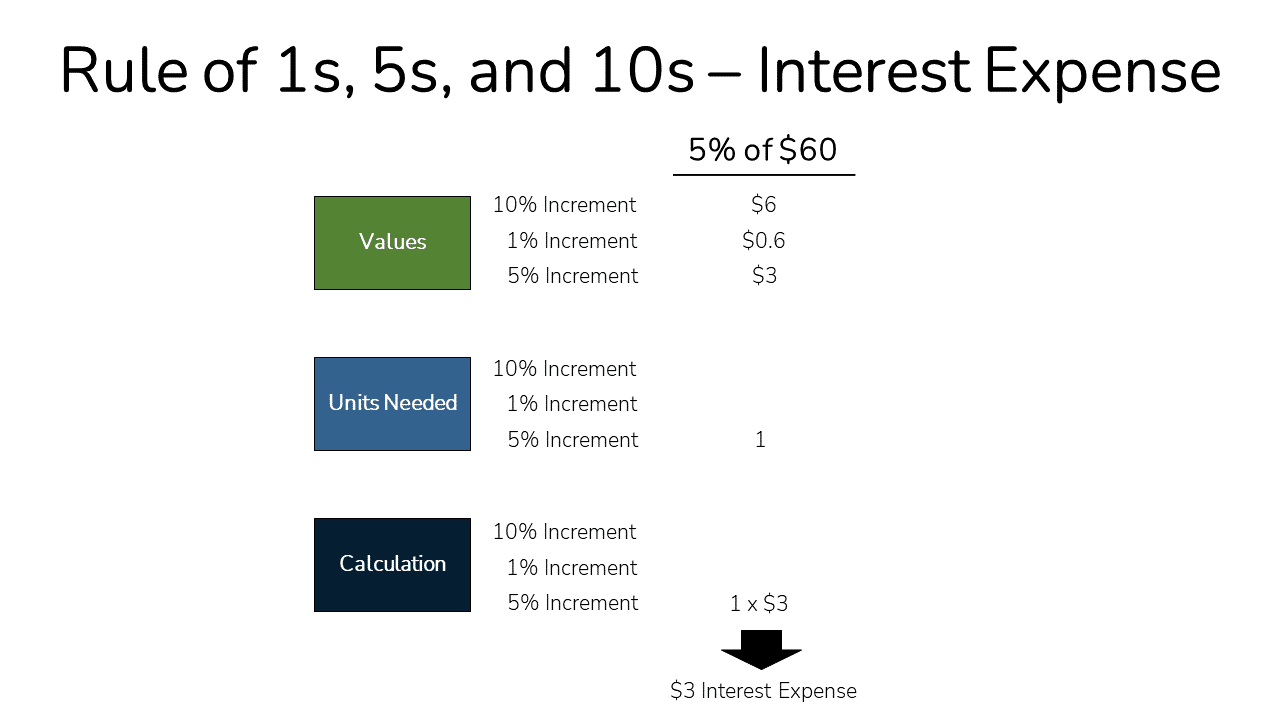
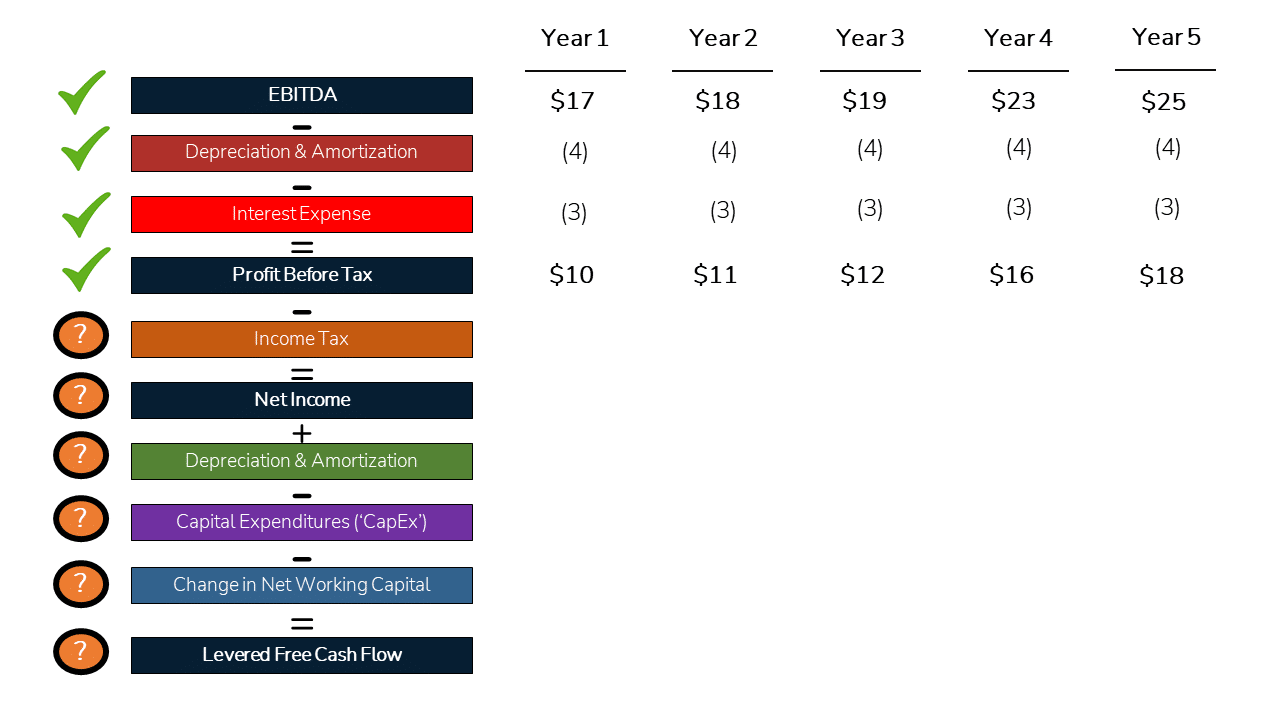
Now that we can see that Interest Expense will be $3 per year in all years, we can subtract Interest Expense to calculate Profit Before Tax (PBT).
Income Tax Calculation
The Paper LBO prompt stated that Income Tax Rate is 20%.
We will apply the 20% Rate to our Profit Before Tax (i.e., ‘Taxable Income’) to calculate our Taxes Owed (‘Income Tax Expense’).
Once again, we can use the Rule of 1s, 5s, and 10s to calculate Income Tax Expense.
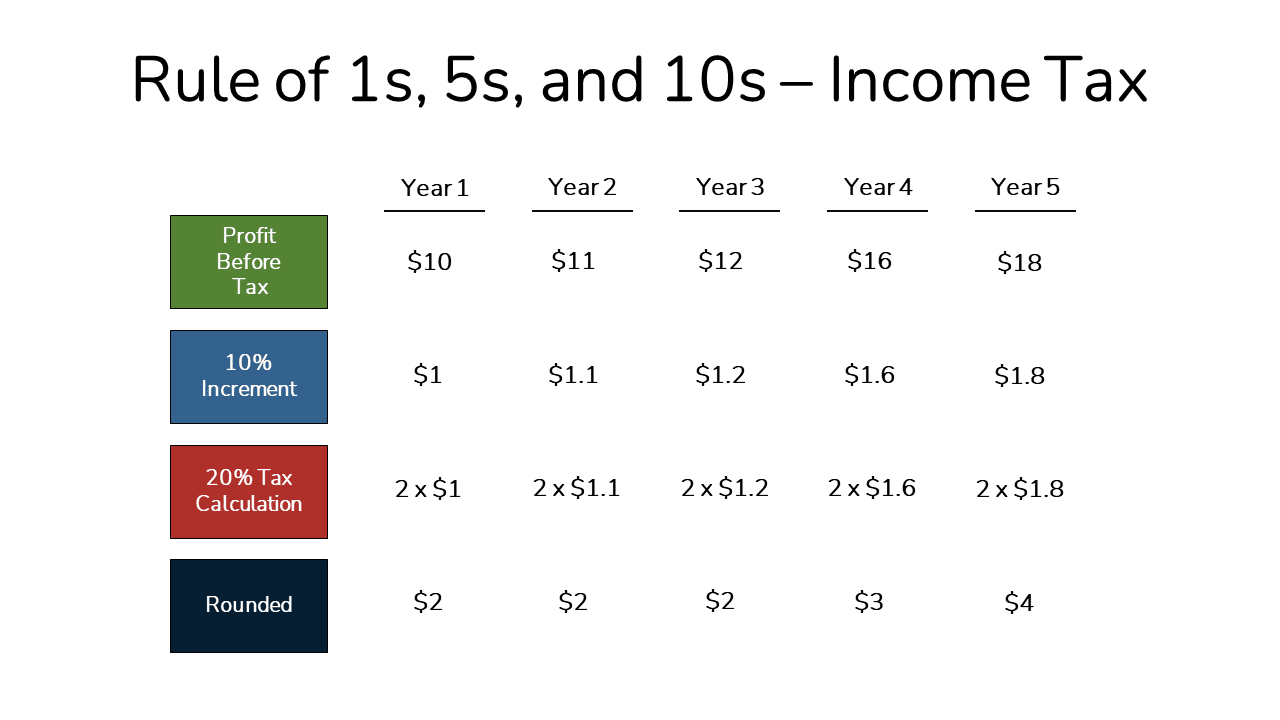
With Income Tax Expense calculated, we can calculate Net Income.
From this point, we need to make just a few more adjustments to get to Levered Free Cash Flow.
D&A, Capital Expenditures, and Net Working Capital
Going back to an earlier step, we deducted D&A Expense because it lowers our tax bill, but D&A is a non-cash charge.
So we now need to add back D&A Expense to calculate Levered Free Cash Flow.
With Capital Expenditures (‘CapEx’), we could use the percentage of sales calculation provided in the prompt.
But remember that we didn’t project out Revenue.
And CapEx remains constant as a percentage of sales over the projection period.
So we can apply the same growth factors as before to project CapEx.
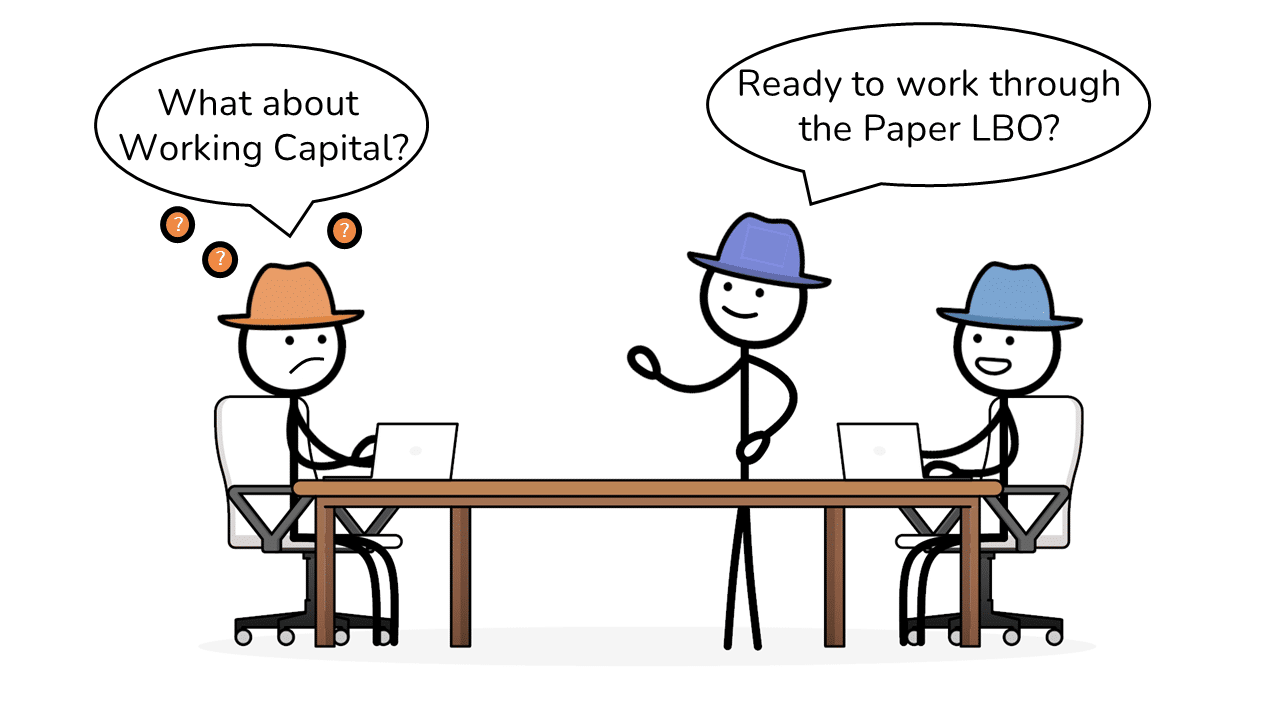
Finally, the Paper LBO prompt stated that Net Working Capital would use up $2 of Cash each year.
We can now complete the calculation down to Levered Free Cash Flow, which you can see below.
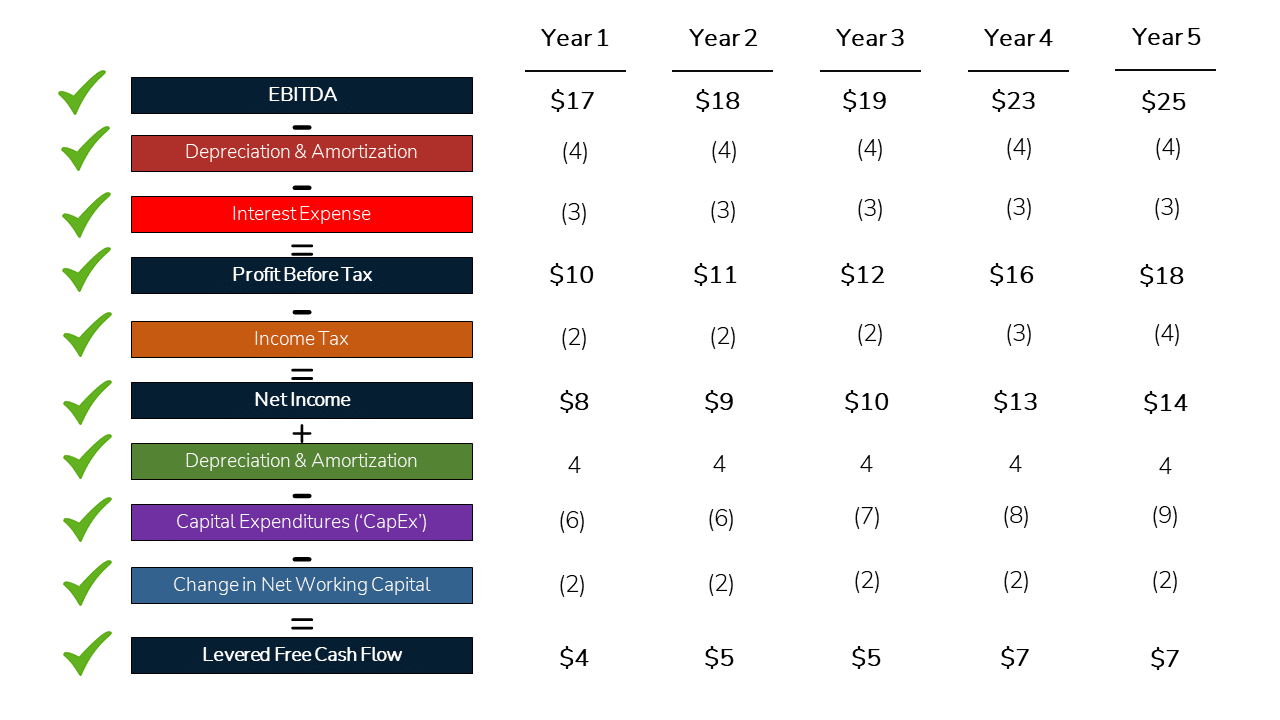
In total, you will have $28 of Cumulative Levered Free Cash Flow to pay down Debt at the Exit (at the end of Year 5).
Curious as to what you would have calculated if you were working in a spreadsheet?
Drum roll…
$29 of Cumulative Levered Free Cash Flow.
As you can see, even with a little bit of rounding, you arrive at nearly the same exact answer!
On that note, we will take this a step further and just say the business will generate $30 of Cumulative Levered Free Cash Flow to make our lives easier as we move ahead.
Congrats, you’ve completed step #3!
Before we continue to Step #4, let’s talk about a few common complications that can arise with Levered Free Cash Flow calculations in a Paper LBO exercise.
Calculation Note #1: CapEx and Depreciation
For a Paper LBO, we will typically calculate Capital Expenditures and Depreciation as a percentage of Sales unless a constant number is provided.
But sometimes, the prompt will only provide one of the two items.
Here’s how to deal with that situation.
For a mature Business, Capital Expenditures should roughly equal Depreciation.
And most LBO transactions will involve a mature business.

For more on why Leveraged Buyouts typically occur with mature businesses, check out this Animated Explainer Video.
So, it is generally reasonable in a Paper LBO exercise to assume that the target business is mature.
As such, if the Interviewer does not provide D&A, you can usually assume that CapEx = D&A.
And vice versa, if you are only given D&A, you could assume that D&A roughly approximates CapEx.
Before making this assumption, you should always say something like, ‘I’m going to assume CapEx = D&A. Is that OK?’
Calculation Note #2: Income Taxes
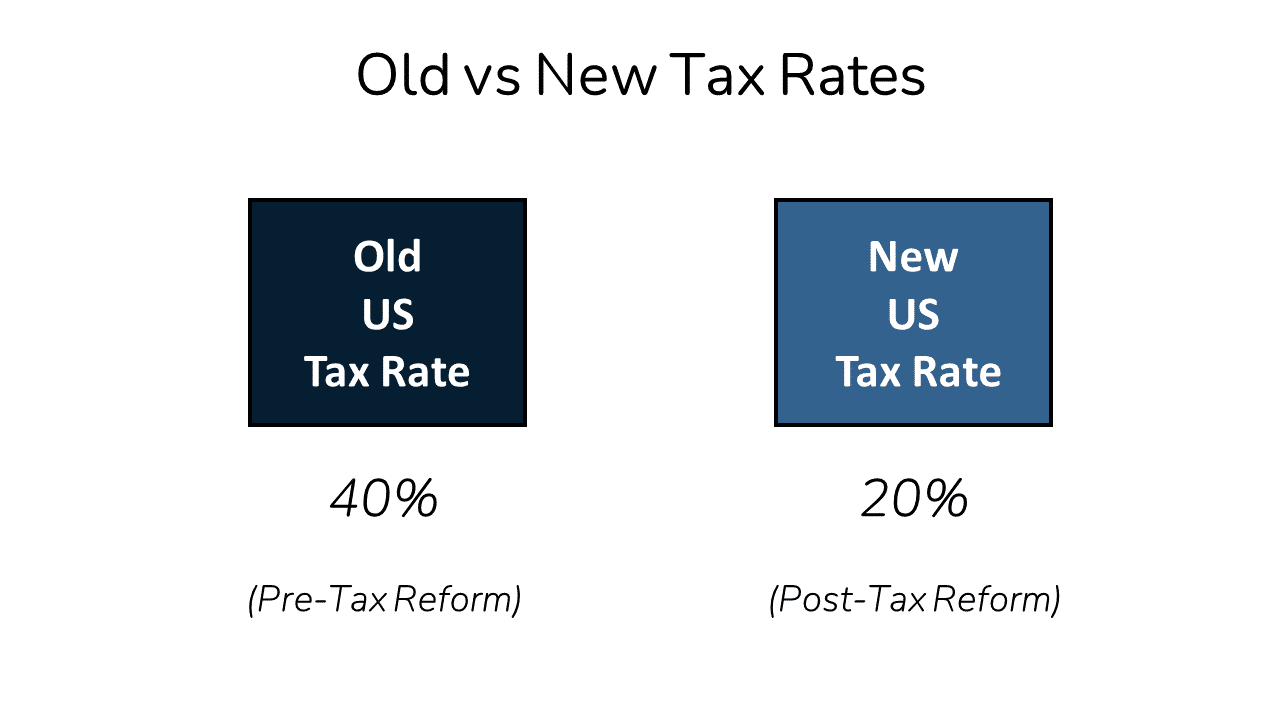
Prior to the Tax Reform in 2017, the US Corporate Tax Rate was in the range of 35-40%, depending on a Company’s Taxable Income.
Since 2018, the Federal Tax Rate has been 21%. Additional State and Local Taxes often lead to an all-in 25%-26% Tax Rate.
To keep it simple, we recommend using a 20% Tax Rate if the tax rate is not provided for a Paper LBO.
Despite the changes above, some Paper LBO cases will use the 40% Tax Rate.
In that case, you can just use (4 * 10% Tax Rate) to calculate Income Taxes.
Calculation Note #3: NWC – Source & Uses of Cash
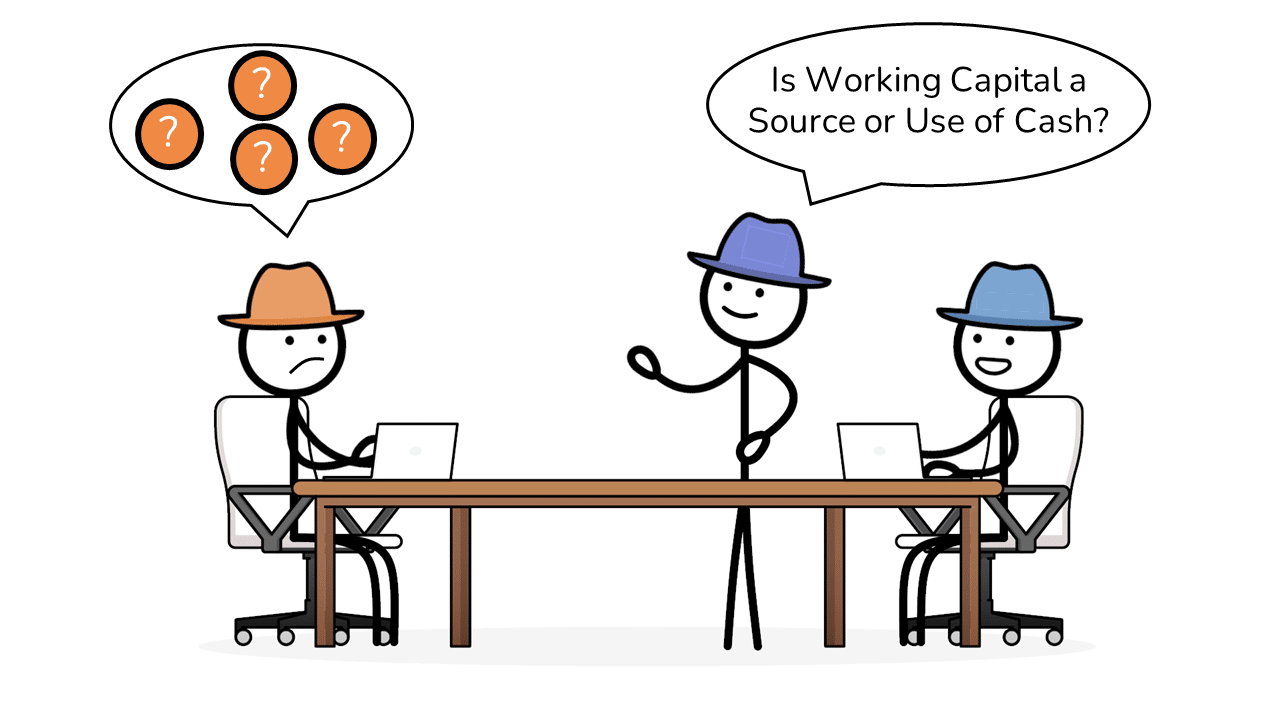
Net Working Capital (NWC) is a bit different than the other items in the calculations, as you can see.
In short, we are calculating whether the aggregate of working Capital is a net Source of Cash or Use of Cash.
If you’re not familiar with the mechanics of these calculations, check out this video on Net Working Capital.
Calculation Note #4: NWC – The Assumption
In most Paper LBO cases, the Interviewer will provide a Net Working Capital as a Percentage of Sales assumption or a Constant Dollar Value.
In the event that the Interviewer doesn’t provide that assumption, you could say: ‘For simplicity’s sake, can we assume that Net Working Capital equals zero?’
If they say yes, life is easy.
However, if they say no, then ask what a reasonable assumption should be. Then off you go!
One last note here.
Some businesses can have Negative Working Capital, which results in a Cash Inflow as a business grows.
If you are not familiar with the concept of Negative Working Capital, check out this Quick Video walkthrough of all of the mechanics.
Once you have incorporated all of the above items, you’ll arrive at Cash Flow for each year of the Paper LBO.
With those points covered, we can move on to the next step, which is our Exit Analysis.
Paper LBO Step #4: Create Exit Analysis
We will assume that the Private Equity Fund sells the Business at the end of the five-year projection period, as noted in the prompt.
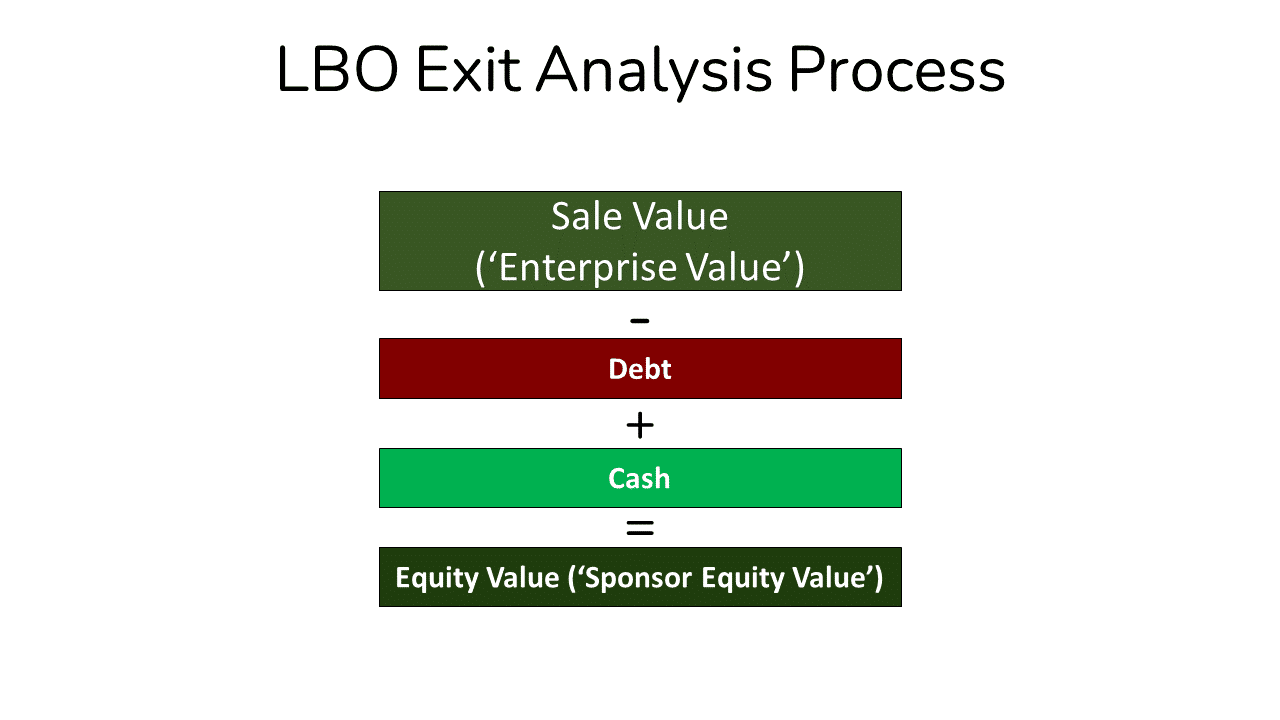
In this step, we need to determine the Sale Value of the Business (again, ‘Enterprise Value’).
From there, we will incorporate both Debt and Cash to calculate the Net Proceeds (‘Equity Value’) to the PE Fund.
When the PE fund puts a Business up for sale, a Prospective Buyer will typically use the same valuation approach we saw earlier.
In other words, the Buyer will assess the Company’s EBITDA at the time of Sale, typically for the most recent ‘Last Twelve Months’ or ‘LTM’ period.
Calculating the Enterprise Value at Sale
In our Paper LBO, the LTM period would be EBITDA in the final year of our projections.
Once we have calculated the Sale Value, we can then calculate the Net Sale Proceeds (i.e., Exit Equity Value) to the Private Equity Fund.
To get to Net Proceeds, we need to subtract Debt and add Cash at the time of the sale (i.e., the end of Year 5).
So, we’ll take the Debt we initially used to fund the Transaction and subtract the Cumulative Cash Flow generated by the Business over the projection period.
The net of Debt and Cumulative Cash Flow is what the Private Equity fund will have to pay down before collecting and Sale Proceeds.
Below, you can see the complete calculation from the Exit Sale Value to Net Proceeds (‘Equity Value‘).
Now that we have determined how much money the PE firm will take home, we can move on to Step #5 and assess the returns from the deal.
Paper LBO Step #5: Assess Returns
After we calculate the net proceeds, we can then assess the returns of the Deal to the Private Equity Investors!
We will need the two items for this calculation: the Dollars Invested (‘Sponsor Equity’ from Step #2) and Dollars Returned (‘Net Proceeds’ from Step #4).
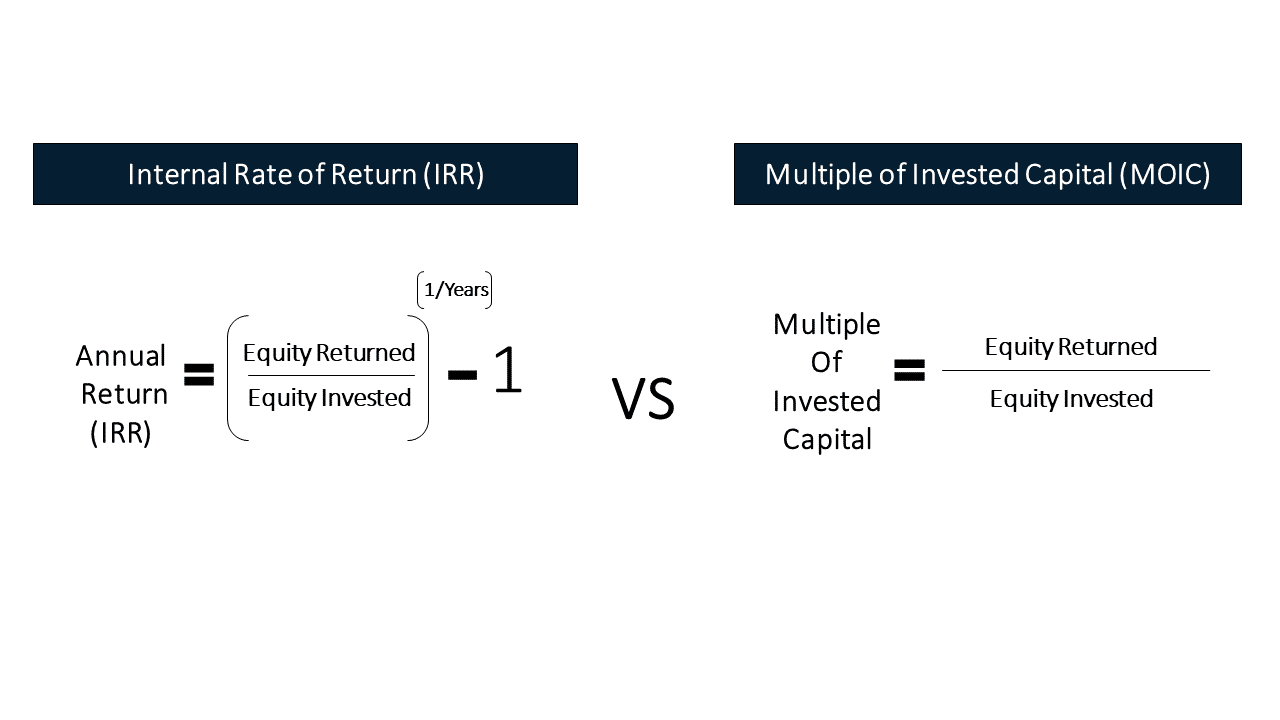
In Private Equity, there are two standard return metrics: Internal Rate of Return (IRR) and Multiple of Invested Capital (MOIC).

MOIC reflects purely Dollars Returned vs. Dollars Invested.
In contrast, IRR reflects an implied annualized percentage return for the Investors.
Note: There is a more complicated calculation for IRR, but it is beyond the scope of a Paper LBO discussion.
Below are the summary calculations for each:
At this point, you might be thinking, ‘I think I can do MOIC, but how am I supposed to calculate IRR in my head?!?!’
You’re in luck. You don’t have to!
Mental Math Hack #3: MOIC to IRR Table
We can use a well-known rule of thumb to approximate to IRRs based on the MOIC of a Deal.
Nearly everyone who works on the ‘Buy-Side’ commits these tables to memory.
But of course, they will not tell you that before you Interview.
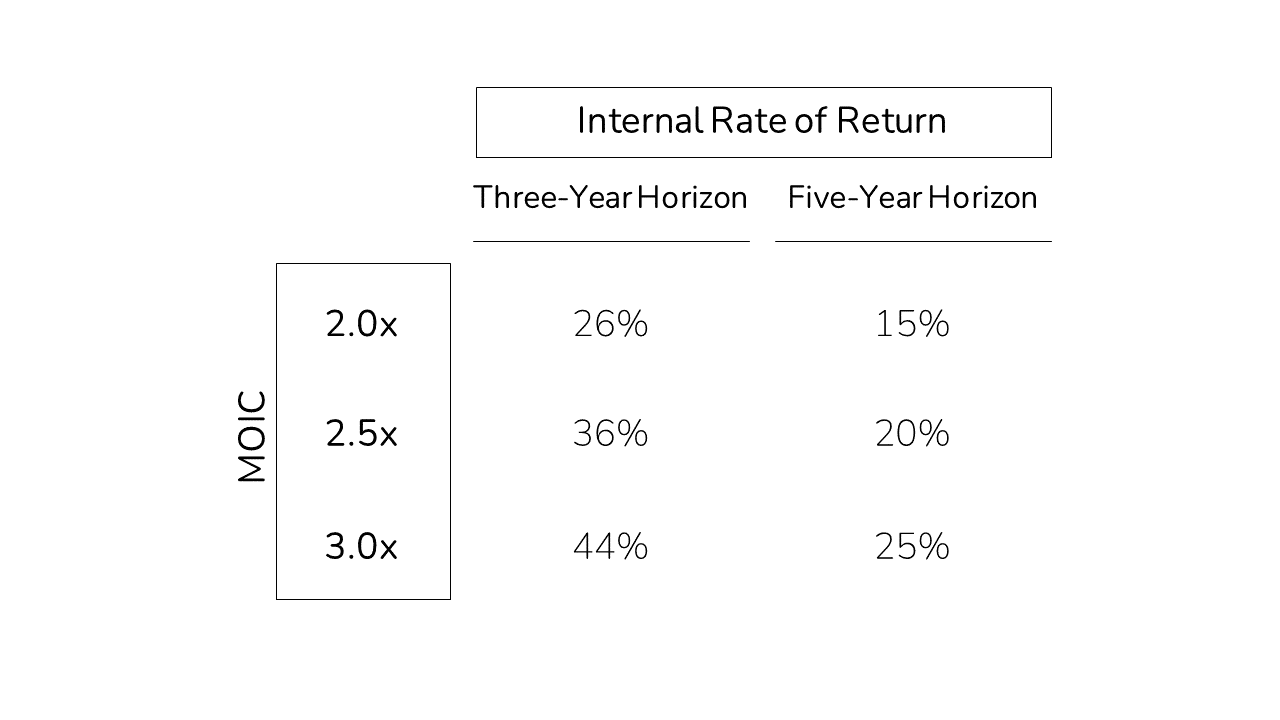
With these tables, you can roughly approximate the 3 and 5-Year IRR for an LBO using the MOIC.
For example, in our case, MOIC is 2.8x ($170 Equity Returned / $60 Equity Invested).
So, you could say that the IRR is about three-quarters of the way between 2.5x (20% IRR) and 3.0x (25% IRR).
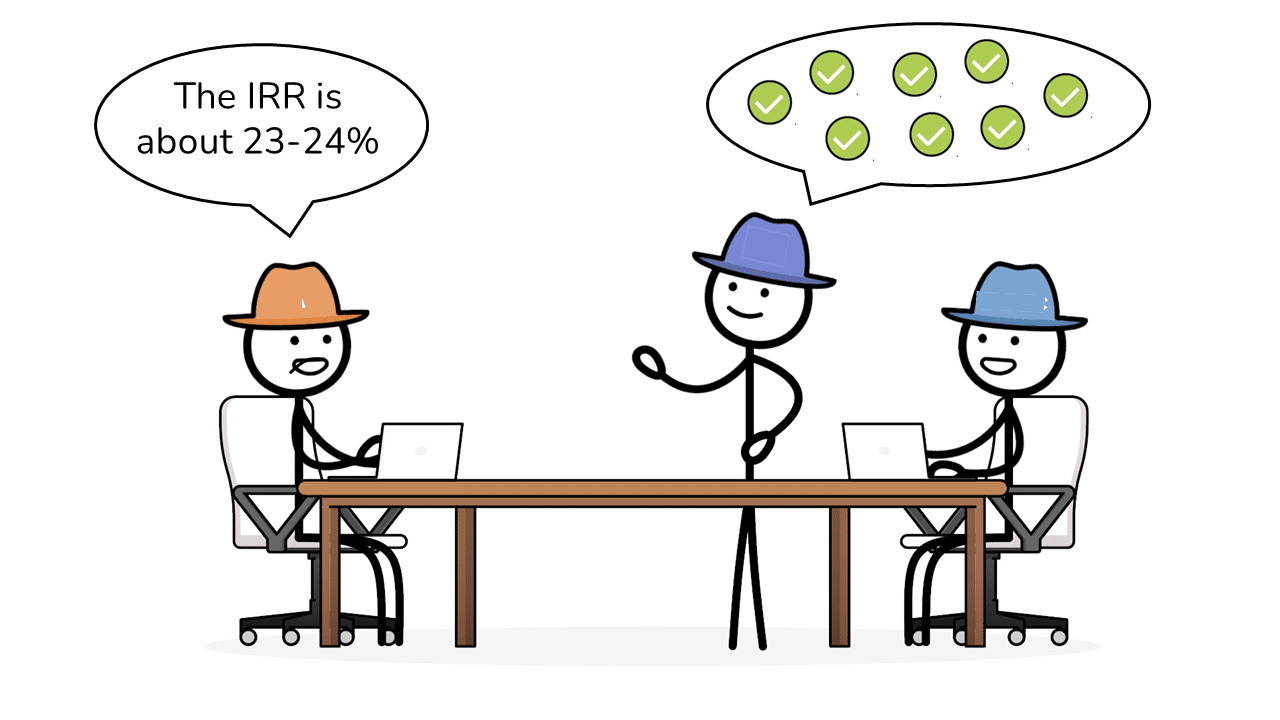
And, so, the approximate IRR is 23-24%.
The actual, calculated IRR is 22% so, again, we are not far off.
As you can see above, you can get very close to the IRR without crazy mental math.
The Reverse Paper LBO
Let’s now imagine that you’ve passed the initial Core Paper LBO test.
You have calculated the Approximate IRR as 23-24%.
At this point, you are feeling pretty proud of yourself.
Then the Interviewer says, “What level of EBITDA growth would you need to get to a 25% IRR?”
You can’t create a sensitivity analysis on the spot. You’re not a supercomputer!
As you would probably guess at this point, you do not need to be a computer.
Jump ahead to see how to nail this exercise with ease!
Again, before we dive in, it is worth mentioning that the exercise we are about to work through is constantly used on the job in Private Equity!
The 5 Steps for a Reverse Paper LBO
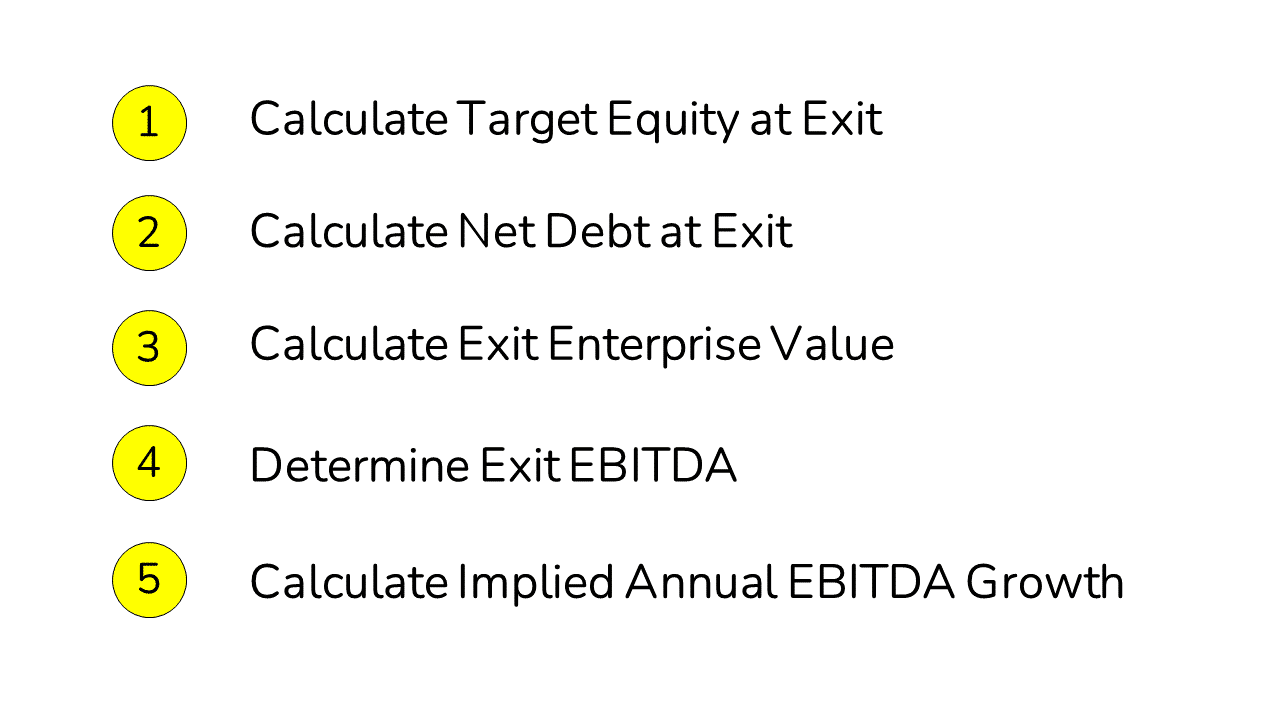
To work through this exercise, you’ll need to complete the following steps:
- Calculate Target Equity at Exit – work from Starting Equity to Ending Equity using the T arget MOIC.
- Calculate Net Debt at Exit – work to Ending Net Debt by taking Debt from the Sources & Uses and Subtracting the Cumulative Cash Flow from the Core Paper LBO.
- Calculate Exit Enterprise Value – add Ending Equity and Ending Net Debt.
- Determine Exit EBITDA – divide Exit Enterprise Value by the Entry Multiple to determine the required Exit EBITDA.
- Calculate Implied Annual EBITDA Growth – approximate to an annual growth rate in EBITDA.
This probably looks like quite a lot at first glance.
But it is just the flip of the Core Paper LBO we just completed.
Lets’ dive in!
Reverse Paper LBO Step #1: Calculate Target Equity at Exit
If we target a return of 3.0x (or 25% IRR), then every dollar we invest needs to become three dollars at the end of Year 5.
So, the first step here is to multiply the Initial Equity Investment by 3.0x to arrive at the required Exit Equity of $180, which you can see below:
Reverse Paper LBO Step #2: Calculate Net Debt at Exit
Next, we need to calculate the value of Debt and Cash at the end of Year 5.
We can take the starting Debt from our Sources and Uses from Step #2 of the Core LBO.
And we can take the Cumulative Cash Flow from Step #3 of the Core LBO.
We would then subtract cumulative Cash Flow from Debt to arrive at the level of Debt that the Private Equity Fund must pay down at Exit.
Reverse Paper LBO Step #3: Calculate Exit Enterprise Value
We then combine Exit Equity and Exit Net Debt to arrive at the required Exit Enterprise Value at the time of Sale.
In other words, this is the Valuation (in dollar terms) that we would need to sell at to achieve the target return of 3.0x (25% IRR).
Next, we will use this Targeted Exit Enterprise value to determine the required EBITDA at Exit.
Reverse Paper LBO Step #4: Determine Exit EBITDA
To find the required EBITDA at Exit, we divide the Exit Enterprise Value by the expected EV/EBITDA Multiple in Year 5.
In PE, it is generally OK to assume the Exit EV/EBITDA Multiple is the same as the Entry multiple.
While there are exceptions to this Rule, you can safely make this assumption in a Paper LBO exercise.
Below we make that assumption, and you can see that the Business will need to generate about $25M of EBITDA to achieve the targeted return.
Reverse Paper LBO Step #5: Calculate Implied Annual EBITDA Growth
At this point, we can take the starting EBITDA and the Ending EBITDA and determine the approximate annual growth.
For low growth rates, you could likely get away with a simple average.
For example, if Exit EBITDA is 15% higher than at Entry. We could say…roughly 3% per year (15% / 5).
The actual answer is 2.8%, which is not far off from our estimate.
For high growth rates (10% or more), you can anchor back to the MOIC to IRR table we used earlier.
Below we added a threshold for 10% as a point of reference for the typical five-year time horizon.
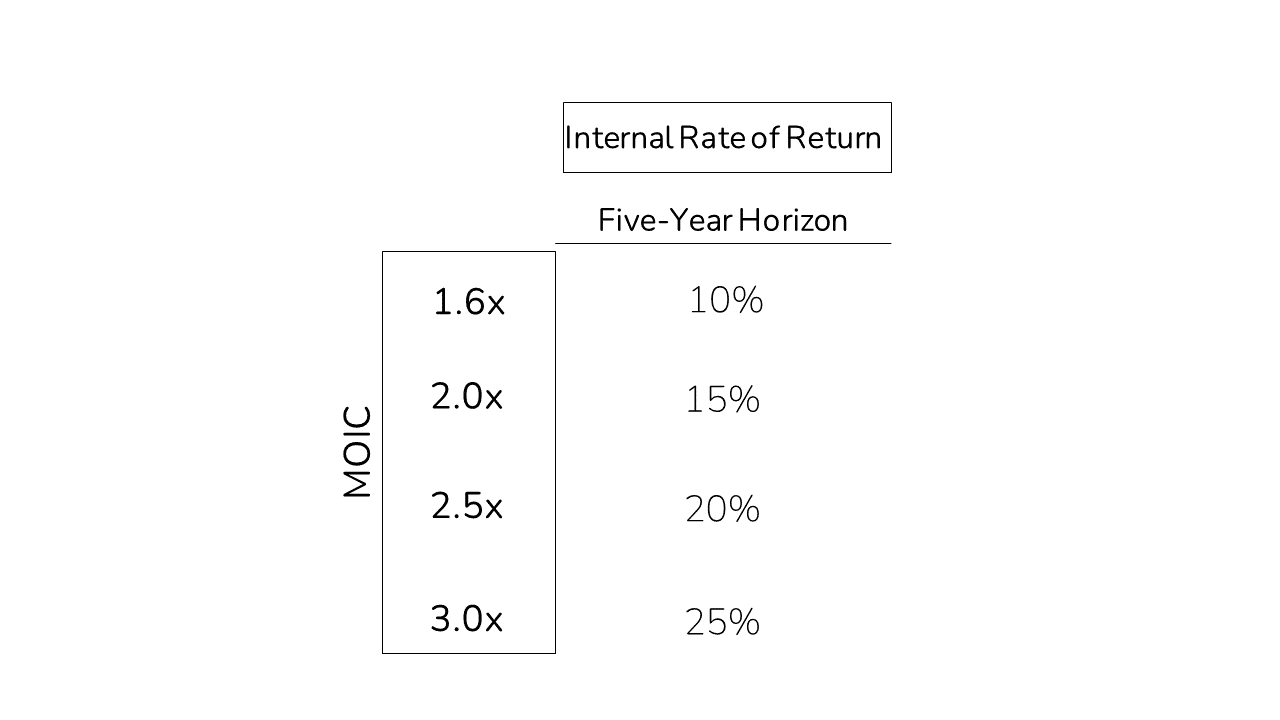
In our case, you would need to believe that EBITDA grows from $15 to $25 over five years (~1.7x).
Looking at the table above, we see that 10% growth is a 1.6x increase.
So, EBITDA would need to grow just over 10% per year to achieve a 3.0x (25% IRR Return).
The fully calculated answer is 12% per year.
As you can see, we were very close with our rules of thumb.
From this point, you should discuss the two key drivers that would get you there:
- Revenue Growth
- EBITDA Margin Expansion
As a final note, we are anchoring to the Cash Flow generated in the original case.
So, this approach is approximately correct. However, the further the Target Return is from the IRR of the Original Case, the less accurate you’ll be.
More Advanced Paper LBO Variations
So…we have worn ourselves out writing everything you see in this article.
So, we’re taking a little break for now.
From here, there are quite a few additional topics to cover related to Paper LBOs.
A few sample topics are:
- How to cut Levered Free Cash Flow Calculation time down by ~60%
- How to convert IRR to MOIC
- LTM vs NTM Multiples
- Inconsistent projections in the case prompt
- Multiple pieces of Debt Funding with annual Paydown
- Preferred Equity
- Management Option Pools
We also plan to put together a comprehensive Paper LBO Excel Template.
We will accelerate Part 2 of this article (plus the template) to elaborate on the topics above if we get enough interest.
Once we cross 500 sign-ups below, we get to work on the topics above.
In the meantime, we hope you’ve found this helpful.
Wrap-Up: The Paper LBO
Hopefully, you now have a much better understanding of the Paper LBO Process.
And also understand the underlying idea behind each of the steps.
Let us know if you have any questions in the comments below. We’d love to hear from you!
About the Author

Mike Kimpel is the Founder and CEO of Finance|able, a next-generation Finance Career Training platform. Mike has worked in Investment Banking, Private Equity, Hedge Fund, and Mutual Fund roles during his career.
He is an Adjunct Professor in Columbia Business School’s Value Investing Program and leads the Finance track at Access Distributed, a non-profit that creates access to top-tier Finance jobs for students at non-target schools from underrepresented backgrounds.
Frequently Asked Questions
A Paper LBO is the process in which you complete a full LBO analysis with just pen and paper.
In most cases, you will be given 10-15 minutes to work through the Paper LBO. However, this can vary depending on the difficulty of the case.
You are generally not allowed to use a calculator. The trick here is to learn a few mental math tricks (see above) that help you work through complicated calculations.


Great stuff